OPEN-SOURCE SCRIPT
Aggiornato [blackcat] L2 Dragon Cloud
Level 2
Background
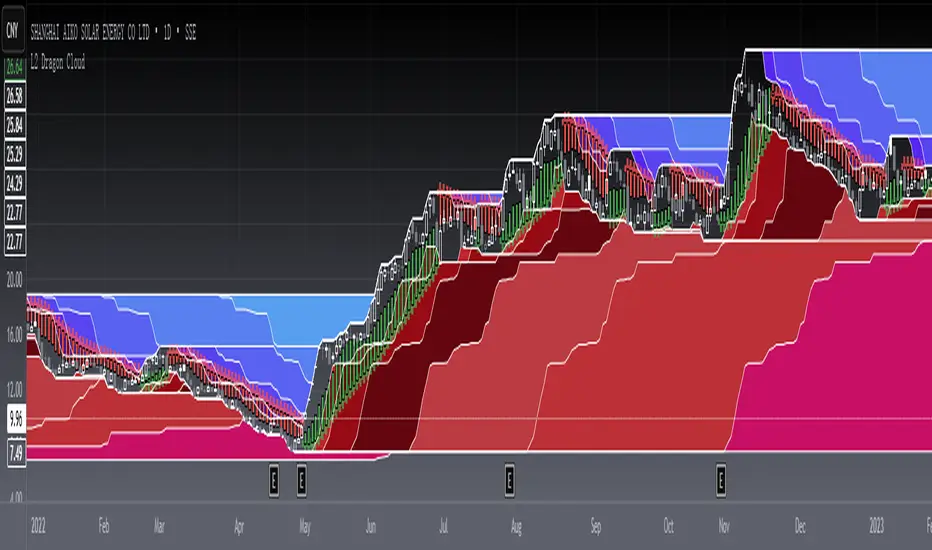
In addition to characterizing the trend through the special parameter SAR, this dragon cloud indicator also indicates that it is currently in the corresponding stage of the bull and bear market through the cloud layer of the large parameter.
Function
The SAR indicator characterizes short-term trend changes and provides swing buying and selling points. Red crosses and candles represent declines and their strength; green crosses and candles represent rises and their strength. At the same time, this technical indicator can judge which stage the market is currently in through the thickness of the bear cloud and the thickness of the bull cloud. When the blue cloud layer on the main picture is relatively thick, it means that it is in a deep bear market; as the blue cloud becomes thinner, and the red cloud is edited, it means that the bull-bear power game is in the process of transformation. The red cloud indicates the strength of doing more, and when its thickness is greater than the blue cloud, it means that the bull market is coming!
Remarks
Feedbacks are appreciated.
Background
In addition to characterizing the trend through the special parameter SAR, this dragon cloud indicator also indicates that it is currently in the corresponding stage of the bull and bear market through the cloud layer of the large parameter.
Function
The SAR indicator characterizes short-term trend changes and provides swing buying and selling points. Red crosses and candles represent declines and their strength; green crosses and candles represent rises and their strength. At the same time, this technical indicator can judge which stage the market is currently in through the thickness of the bear cloud and the thickness of the bull cloud. When the blue cloud layer on the main picture is relatively thick, it means that it is in a deep bear market; as the blue cloud becomes thinner, and the red cloud is edited, it means that the bull-bear power game is in the process of transformation. The red cloud indicates the strength of doing more, and when its thickness is greater than the blue cloud, it means that the bull market is coming!
Remarks
Feedbacks are appreciated.
Note di rilascio
OVERVIEWThe L2 Dragon Cloud indicator combines Parabolic SAR signals with dynamic cloud levels to provide comprehensive market analysis. 🌟 This advanced script features a weighted moving average calculation and custom SAR implementation for precise trend identification. The Dragon Cloud system presents multiple resistance/support levels that form distinct colored zones, offering traders valuable insights into potential price movements.
FEATURES
• Custom Weighted Moving Average (WMA) calculation 🔢
• Advanced Parabolic SAR implementation 📈
• Dynamic Dragon Cloud levels with 7 tiers ⛅️
• Color-coded support/resistance zones 🎨
• Real-time trend direction indicators ↕️
HOW TO USE
Apply the indicator to your chart using the default settings.
Observe the SAR dots:
Green dots indicate bullish trends ➡️
Red dots signal bearish trends ⬇️
Analyze the Dragon Cloud zones:
White lines represent key levels ⚪
Colored fills show price action zones 🌈
Use intersection points as potential entry/exit signals ✂️
TECHNICAL DETAILS
• Indicator Type: Overlays on Price Chart 📊
• Calculation Frequency: Per Bar Close ⏱️
• Required Data: High/Low/Close Prices 💰
• Maximum Bars Back: 5000 Historical Candles 📈
LIMITATIONS
⚠️ Please note:
Performance may vary on highly volatile markets
Best suited for longer timeframes (H4 or higher)
Results should be combined with other technical tools
NOTES
This indicator is designed to work across various timeframes but performs optimally when used in conjunction with broader market analysis. 📋 Always consider risk management strategies before making trading decisions based on this indicator's signals.
THANKS
Special thanks to the TradingView community for their continued support and feedback during development. 🙏
Script open-source
Nello spirito di TradingView, l'autore di questo script lo ha reso open source, in modo che i trader possano esaminarne e verificarne la funzionalità. Complimenti all'autore! Sebbene sia possibile utilizzarlo gratuitamente, ricordiamo che la ripubblicazione del codice è soggetta al nostro Regolamento.
Avoid losing contact!Don't miss out! The first and most important thing to do is to join my Discord chat now! Click here to start your adventure: discord.com/invite/ZTGpQJq 防止失联,请立即行动,加入本猫聊天群: discord.com/invite/ZTGpQJq
Declinazione di responsabilità
Le informazioni e le pubblicazioni non sono intese come, e non costituiscono, consulenza o raccomandazioni finanziarie, di investimento, di trading o di altro tipo fornite o approvate da TradingView. Per ulteriori informazioni, consultare i Termini di utilizzo.