PROTECTED SOURCE SCRIPT
Aggiornato BBMA Strategy - EXT CSD CSM MHV RE Codes
Below is a detailed guide for using and interpreting the "BBMA Strategy - Enhanced EXT CSD CSM with Subplot" indicator. This guide is designed to be added to the description of the indicator when publishing it on TradingView. It provides clear instructions for users on how to apply the indicator, interpret its signals, and understand its features, including the multi-timeframe analysis and subplot table.
BBMA Strategy - Enhanced EXT CSD CSM with Subplot: User Guide
Overview
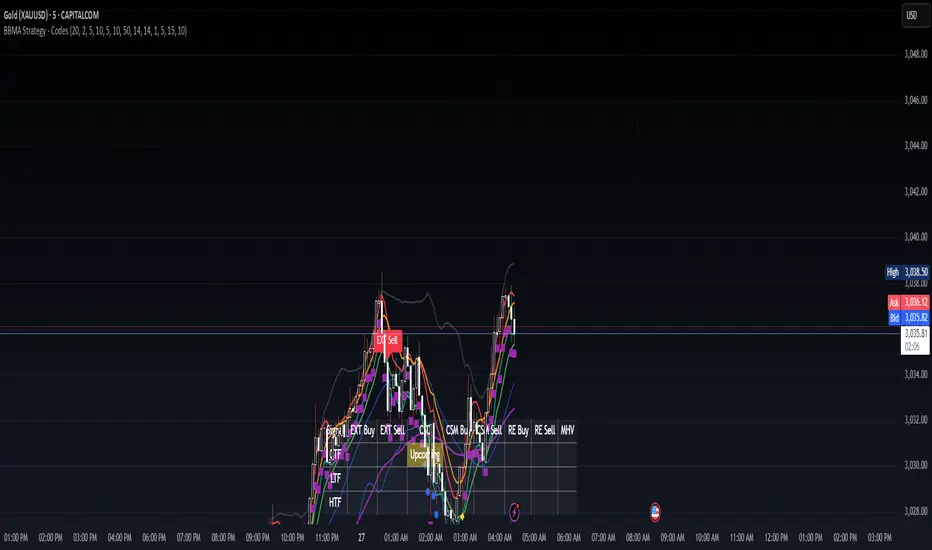
The "BBMA Strategy - Enhanced EXT CSD CSM with Subplot" is a comprehensive trading indicator built on the Bollinger Bands Moving Average (BBMA) framework. It combines multiple technical analysis tools—Bollinger Bands, Moving Averages (MAHI and MALO), EMA, ATR, volume analysis, RSI, MACD, market structure, and candlestick patterns—to identify high-probability trading setups. The indicator supports five key BBMA setups: EXT (Extreme), CSD (Consolidation), CSM (Continuation Setup Movement), RE (Re-Entry), and MHV (Market High Volatility).
This enhanced version includes:
Multi-Timeframe (MTF) Analysis: Confirms signals across a Lower Timeframe (LTF) and Higher Timeframe (HTF) for stronger trade validation.
Subplot Table: Displays signal status ("Active" or "Upcoming") and MTF confirmations in a clear table format.
Market Structure and Volume Filters: Incorporates Break of Structure (BOS), RSI divergence, and volume conditions to filter out low-probability trades.
Customizable Settings: Adjust Bollinger Bands, MA periods, timeframes, and more to suit your trading style.
This indicator is suitable for traders of all levels and can be used across various markets (e.g., forex, crypto, stocks) and timeframes (1M to 1D).
How to Use the Indicator
1. Add the Indicator to Your Chart
Open TradingView and load the chart of your chosen asset (e.g., BTCUSD, EURUSD, XAUUSD).
Go to the Pine Editor, paste the indicator code, and click "Add to Chart."
The indicator will overlay on your chart, displaying Bollinger Bands, Moving Averages, EMA, and signal labels. A subplot table will appear at the bottom of the chart.
2. Configure the Settings
The indicator provides customizable inputs to tailor it to your trading preferences. Access the settings by clicking the gear icon next to the indicator name on your chart:
Bollinger Bands Settings:
BB Period: Default is 20. Adjust the lookback period for Bollinger Bands.
BB Deviations: Default is 2. Adjust the standard deviation for the bands.
MAHI Settings (Moving Averages on High):
MAHI 5 Period: Default is 5. Period for the shorter MA on highs.
MAHI 10 Period: Default is 10. Period for the longer MA on highs.
MALO Settings (Moving Averages on Low):
MALO 5 Period: Default is 5. Period for the shorter MA on lows.
MALO 10 Period: Default is 10. Period for the longer MA on lows.
EMA Settings:
EMA Period: Default is 50. Adjust the period for the Exponential Moving Average.
ATR Settings:
ATR Period: Default is 14. Period for the Average True Range.
ATR SMA Period: Default is 14. Period for the ATR smoothing.
Timeframe Settings:
Minor HTF: Default is 1h. Select the minor higher timeframe for trend confirmation.
Major HTF: Default is 4h. Select the major higher timeframe for trend confirmation.
Lower TF for Confirmation: Default is 5m. Select the lower timeframe for signal confirmation.
Market Structure Settings:
Market Structure Lookback: Default is 10. Adjust the lookback period for swing highs/lows in market structure analysis.
3. Select Your Chart Timeframe
The indicator works on any timeframe from 1 minute (1M) to 1 day (1D).
For best results, align your chart timeframe (Current Timeframe, CTF) with the LTF and HTF settings:
Example: If CTF is 15m, set LTF to 5m and HTF to 1h or 4h.
This ensures proper multi-timeframe alignment for signal confirmation.
Indicator Components
Main Chart Elements
Bollinger Bands (BB): Plotted as three lines (upper, middle, lower) to identify volatility and potential reversal zones.
Upper Band: Blue line.
Middle Band: Black line (basis).
Lower Band: Blue line.
MAHI (Moving Averages on High): Two weighted moving averages on highs to detect trend direction.
MAHI 5: Green line.
MAHI 10: Lime line.
MALO (Moving Averages on Low): Two weighted moving averages on lows to confirm trend direction.
MALO 5: Red line.
MALO 10: Orange line.
EMA (50-period): Purple line to identify the overall trend.
Signal Labels: Appear on the chart when a setup is confirmed:
EXT Buy: Green upward arrow (reversal buy at BB lower band).
EXT Sell: Red downward arrow (reversal sell at BB upper band).
CSM Buy: Teal upward arrow (continuation buy above BB middle).
CSM Sell: Maroon downward arrow (continuation sell below BB middle).
RE Buy: Aqua upward arrow (re-entry buy between BB lower and middle).
RE Sell: Fuchsia downward arrow (re-entry sell between BB upper and middle).
MHV: Orange label (high volatility breakout after consolidation).
CSD: Yellow diamond (consolidation signal).
Subplot Table
Located at the bottom of the chart, the table summarizes signal status across three timeframes:
CTF (Current Timeframe): Shows "Active" (signal confirmed) or "Upcoming" (signal forming) for each setup.
LTF (Lower Timeframe): Displays a checkmark (✔) if the signal is confirmed on the LTF.
HTF (Higher Timeframe): Displays a checkmark (✔) if the signal is confirmed on the HTF.
Columns represent the five BBMA setups: EXT Buy, EXT Sell, CSD, CSM Buy, CSM Sell, RE Buy, RE Sell, and MHV.
Interpreting the Signals
1. EXT (Extreme) Setup
EXT Buy (Green Arrow):
Condition: Price touches or breaks below the BB lower band, closes above it, with high ATR volatility, strong volume, and additional confirmations (e.g., hammer candle, RSI oversold, MACD bullish, MAHI/MALO crossover, or bullish divergence).
Interpretation: A potential reversal buy signal. Look for confirmation in the subplot table (LTF and HTF rows).
Action: Consider a long position if LTF and HTF confirm (✔ in both rows). Use the BB middle or upper band as a target.
EXT Sell (Red Arrow):
Condition: Price touches or breaks above the BB upper band, closes below it, with high ATR volatility, strong volume, and additional confirmations (e.g., shooting star candle, RSI overbought, MACD bearish, MAHI/MALO crossunder, or bearish divergence).
Interpretation: A potential reversal sell signal.
Action: Consider a short position if LTF and HTF confirm. Use the BB middle or lower band as a target.
2. CSD (Consolidation) Setup
CSD (Yellow Diamond):
Condition: BB width is narrow (below its SMA), low ATR volatility, small candles, and no MAHI/MALO crossovers.
Interpretation: The market is consolidating, often preceding a breakout (e.g., MHV).
Action: Avoid trading during CSD unless preparing for an MHV breakout. Monitor the subplot for "Upcoming" MHV signals.
3. CSM (Continuation Setup Movement)
CSM Buy (Teal Arrow):
Condition: Price is above the BB middle, MAHI crossover, MALO crossover or MACD bullish, price above EMA 50, with additional confirmations (e.g., bullish engulfing or MACD bullish).
Interpretation: A continuation buy signal in an uptrend.
Action: Enter a long position if LTF and HTF confirm. Target the BB upper band or recent swing highs.
CSM Sell (Maroon Arrow):
Condition: Price is below the BB middle, MAHI crossunder, MALO crossunder or MACD bearish, price below EMA 50, with additional confirmations (e.g., bearish engulfing or MACD bearish).
Interpretation: A continuation sell signal in a downtrend.
Action: Enter a short position if LTF and HTF confirm. Target the BB lower band or recent swing lows.
4. RE (Re-Entry) Setup
RE Buy (Aqua Arrow):
Condition: Price is between the BB lower and middle bands, MAHI crossover, MALO crossover or MACD bullish, price above EMA 50, with additional confirmations (e.g., bullish engulfing or MACD bullish).
Interpretation: A re-entry buy signal after a pullback in an uptrend.
Action: Enter a long position if LTF and HTF confirm. Target the BB middle or upper band.
RE Sell (Fuchsia Arrow):
Condition: Price is between the BB upper and middle bands, MAHI crossunder, MALO crossunder or MACD bearish, price below EMA 50, with additional confirmations (e.g., bearish engulfing or MACD bearish).
Interpretation: A re-entry sell signal after a pullback in a downtrend.
Action: Enter a short position if LTF and HTF confirm. Target the BB middle or lower band.
5. MHV (Market High Volatility) Setup
MHV (Orange Label):
Condition: Follows a CSD signal, with expanding BB width, high ATR volatility, strong volume, and MAHI/MALO crossover or crossunder.
Interpretation: A breakout signal after consolidation, indicating high volatility and potential for a strong move.
Action: Trade in the direction of the breakout (e.g., buy if MAHI crossover, sell if MAHI crossunder). Confirm with LTF and HTF. Target significant levels like recent swing highs/lows.
6. Multi-Timeframe Confirmation
LTF Confirmation: A checkmark (✔) in the LTF row indicates the signal is also present on the lower timeframe (e.g., 5m). This adds confidence to the trade.
HTF Confirmation: A checkmark (✔) in the HTF row indicates alignment with the higher timeframe trend (e.g., 4h). This confirms the signal's strength.
Strongest Signals: Look for signals with both LTF and HTF confirmations (✔ in both rows). These have the highest probability of success.
7. Upcoming Signals
The CTF row in the subplot table may show "Upcoming" for a setup (e.g., EXT Buy: Upcoming). This indicates the setup is forming but not yet confirmed.
Action: Monitor these setups closely. They may turn "Active" on the next candle if conditions are met.
Trading Tips
Trend Alignment: Use the EMA 50 and market structure (is_uptrend) to ensure trades align with the overall trend. For example, prioritize CSM Buy signals in an uptrend.
Risk Management:
Set stop-losses below recent swing lows (for buys) or above recent swing highs (for sells).
Use the BB middle or opposite band as a target for most setups.
Avoid Overtrading: Focus on signals with LTF and HTF confirmations to filter out noise.
Timeframe Selection:
Scalping: Use 1m or 5m CTF with 1m LTF and 15m HTF.
Day Trading: Use 15m or 1h CTF with 5m LTF and 4h HTF.
Swing Trading: Use 4h or 1D CTF with 1h LTF and 1D HTF.
Backtesting: Test the indicator on historical data for your chosen asset and timeframe to understand its performance.
Alerts
The indicator includes built-in alerts for each setup:
EXT Buy/Sell: Triggers when an EXT signal is confirmed.
CSD: Triggers during consolidation.
CSM Buy/Sell: Triggers for continuation signals.
RE Buy/Sell: Triggers for re-entry signals.
MHV: Triggers for high volatility breakouts. To set up alerts:
Right-click on the chart and select "Add Alert."
Choose the condition (e.g., "BBMA EXT Buy").
Set your preferred notification method (e.g., email, SMS).
Limitations
Lagging Indicators: The indicator uses moving averages and other lagging tools, which may delay signals in fast-moving markets.
False Signals: Like all indicators, it can produce false signals, especially in choppy markets. Use LTF/HTF confirmations to filter trades.
Timeframe Dependency: Ensure your CTF, LTF, and HTF are properly aligned to avoid conflicting signals.
Note di rilascio
Below is the concise guide updated with the indicator name "BBMA Strategy - With Codes" for the TradingView description. It provides clear instructions for use and interpretation in a brief format.---
## BBMA Strategy - With Codes: Quick Guide
### Overview
"BBMA Strategy - With Codes" is a robust Bollinger Bands Moving Average (BBMA) indicator that identifies high-probability setups: **EXT (Extreme)**, **CSD (Consolidation)**, **CSM (Continuation Setup Movement)**, **RE (Re-Entry)**, and **MHV (Market High Volatility)**. It combines Bollinger Bands, MAHI/MALO, EMA, ATR, volume, RSI, MACD, market structure, and candlestick patterns, with multi-timeframe (MTF) confirmation and a subplot table.
Works on all markets (forex, crypto, stocks) and timeframes (1M to 1D).
---
### How to Use
#### 1. Add to Chart
- Load your chart on TradingView (e.g., BTCUSD).
- Paste the code in the Pine Editor and click "Add to Chart."
- The indicator overlays Bollinger Bands, MAs, EMA, and signal labels, with a subplot table at the bottom.
#### 2. Configure Settings
Adjust inputs via the gear icon:
- **BB Period/Deviations**: Default 20/2.
- **MAHI/MALO Periods**: Default 5/10 for both.
- **EMA Period**: Default 50.
- **ATR Periods**: Default 14.
- **Timeframes**: Minor HTF (1h), Major HTF (4h), LTF (5m).
- **Market Structure Lookback**: Default 10.
#### 3. Choose Timeframe
- Use any timeframe (1M to 1D).
- Align CTF (Current Timeframe) with LTF/HTF (e.g., 15m CTF, 5m LTF, 4h HTF).
---
### Indicator Components
#### Main Chart
- **Bollinger Bands**: Upper (blue), Middle (black), Lower (blue).
- **MAHI**: 5 (green), 10 (lime).
- **MALO**: 5 (red), 10 (orange).
- **EMA 50**: Purple.
- **Signals**:
- **EXT Buy/Sell**: Green/Red arrows (reversal at BB bands).
- **CSM Buy/Sell**: Teal/Maroon arrows (continuation).
- **RE Buy/Sell**: Aqua/Fuchsia arrows (re-entry).
- **MHV**: Orange label (breakout).
- **CSD**: Yellow diamond (consolidation).
#### Subplot Table
- **CTF Row**: Shows "Active" (confirmed) or "Upcoming" (forming) signals.
- **LTF/HTF Rows**: Checkmark (✔) if confirmed on Lower/Higher Timeframe.
---
### Interpreting Signals
- **EXT Buy/Sell**: Reversal at BB lower/upper. Long/short if LTF/HTF confirm (✔). Target BB middle/opposite band.
- **CSD**: Consolidation (yellow diamond). Prepare for MHV breakout.
- **CSM Buy/Sell**: Continuation above/below BB middle. Long/short if LTF/HTF confirm. Target BB upper/lower.
- **RE Buy/Sell**: Re-entry between BB bands. Long/short if LTF/HTF confirm. Target BB middle.
- **MHV**: Breakout after CSD. Trade breakout direction with LTF/HTF confirmation.
- **Strongest Signals**: Both LTF and HTF confirm (✔ in both rows).
---
### Trading Tips
- **Trend**: Align trades with EMA 50 and market structure.
- **Risk**: Stop-loss below/above swing lows/highs. Target BB bands or swing levels.
- **Filter**: Prioritize signals with LTF/HTF confirmation.
- **Backtest**: Test on historical data for your asset/timeframe.
---
### Alerts
Set alerts for each setup (e.g., "BBMA EXT Buy") via TradingView’s alert menu.
---
### Limitations
- May lag in fast markets.
- False signals possible in choppy conditions—use MTF confirmation.
- Ensure proper timeframe alignment.
---
### Support
Questions or feedback? Comment on TradingView or message me. Happy trading!
---
This updated description uses the indicator name "BBMA Strategy - With Codes" and remains concise while covering all necessary details for TradingView users. Let me know if you'd like further tweaks!
Script protetto
Questo script è pubblicato come codice protetto. Tuttavia, è possibile utilizzarle liberamente e senza alcuna limitazione – ulteriori informazioni qui.
Declinazione di responsabilità
Le informazioni e le pubblicazioni non sono intese come, e non costituiscono, consulenza o raccomandazioni finanziarie, di investimento, di trading o di altro tipo fornite o approvate da TradingView. Per ulteriori informazioni, consultare i Termini di utilizzo.