Trend Strength Oscillator📌 Trend Strength Oscillator
📄 Description
Trend Strength Oscillator measures the directional strength of price relative to an adaptive dynamic trend band. It evaluates how far the current price is from the midpoint of a trend channel and normalizes this value by recent volatility range, allowing traders to detect trend strength, direction, and potential exhaustion in any market condition.
📌 Features
🔹 Adaptive Trend Band Logic: Uses a modified ATR and time-dependent spread formula to dynamically adjust upper and lower trend bands.
🔹 Trendline Midpoint Calculation: The central trendline is defined as the average between upper and lower bands.
🔹 Relative Positioning: Measures how far the close is from the center of the band as a percentage.
🔹 Range Normalization: Uses a normalized range to account for recent volatility, reducing noise in the oscillator reading.
🔹 Oscillator Output (±100 scale):
+100 indicates strong bullish momentum
-100 indicates strong bearish momentum
0 is the neutral centerline
🛠️ How to Use
✅ Trend Strength > +50: Indicates a strong bullish phase.
✅ Trend Strength < -50: Indicates a strong bearish phase.
⚠️ Crossing above 0: Potential bullish trend initiation.
⚠️ Crossing below 0: Potential bearish trend initiation.
📉 Values near 0: Suggest trend weakness or ranging conditions.
Best suited timeframes: 1H, 4H, Daily
Ideal combination with: RSI, MACD, volume-based oscillators, moving average crosses
✅ TradingView House Rules Compliance
This indicator is written in Pine Script v5 and fully open-source.
The script does not repaint, does not generate false alerts, and does not access external or private data.
It is intended strictly as a technical analysis tool, and not a buy/sell signal generator.
Users are encouraged to combine this tool with other confirmations and independent judgment in trading decisions.
=========================================================
📌 Trend Strength Oscillator
📄 설명 (Description)
Trend Strength Oscillator는 가격이 동적 추세 밴드 내 어디에 위치해 있는지를 정량적으로 분석하여, 추세의 방향성과 강도를 시각적으로 보여주는 오실레이터 지표입니다. 최근 변동성을 반영한 밴드를 기반으로 가격 위치를 정규화하여, 과매수·과매도 상태나 추세의 소멸 가능성까지 탐지할 수 있도록 설계되었습니다.
📌 주요 특징 (Features)
🔹 적응형 추세 밴드 계산: ATR과 시간 경과를 기반으로 상단/하단 밴드를 동적으로 조정
🔹 중심 추세선 산출: 상단과 하단 밴드의 평균값을 중심선으로 활용하여 기준 축 제공
🔹 상대 위치 계산: 현재 종가가 중심선에서 얼마나 떨어져 있는지를 정규화하여 추세 강도 계산
🔹 변동성 기반 정규화: 최근 밴드 범위를 기준으로 상대 거리를 0~100 사이 값으로 변환
🔹 오실레이터 출력 (범위: ±100):
+100에 가까울수록 강한 상승 추세
-100에 가까울수록 강한 하락 추세
0에 가까울수록 횡보 구간 가능성
🛠️ 사용법 (How to Use)
✅ +50 이상: 강한 상승 추세 지속 중
✅ -50 이하: 강한 하락 추세 지속 중
⚠️ 0선 돌파 상향: 상승 추세 시작 가능성
⚠️ 0선 돌파 하향: 하락 추세 시작 가능성
🟡 0 근처 유지: 추세 약화 또는 횡보장 가능성
추천 시간대: 1시간봉, 4시간봉, 일봉
보조 지표로 추천: RSI, MACD, OBV, 이동평균 크로스 등과 함께 활용 시 효과적
✅ 트레이딩뷰 하우스룰 준수사항 (TradingView House Rules Compliance)
본 지표는 Pine Script v5로 작성된 오픈소스 공개용 스크립트입니다.
리페인트(Repaint) 현상이 없으며, **허위 경고(Spam Alerts)**나 성능 저하 요소도 없습니다.
외부 데이터 접근 없이 완전히 자체 계산으로 동작합니다.
이 지표는 투자 판단을 돕기 위한 분석용 도구이며, 직접적인 매수·매도 신호로 사용해서는 안 됩니다.
모든 트레이딩은 사용자의 독립적인 판단과 책임 하에 이루어져야 합니다.
Bande di Bollinger (BB)

Trend Band Oscillator📌 Trend Band Oscillator
📄 Description
Trend Band Oscillator is a momentum-based trend indicator that calculates the spread between two EMAs and overlays it with a volatility filter using a standard deviation band. It helps traders visualize not only the trend direction but also the strength and stability of the trend.
📌 Features
🔹 EMA Spread Calculation: Measures the difference between a fast and slow EMA to quantify short-term vs mid-term trend dynamics.
🔹 Volatility Band Overlay: Applies an EMA of standard deviation to the spread to filter noise and highlight valid momentum shifts.
🔹 Color-Based Visualization: Positive spread values are shown in lime (bullish), negative values in fuchsia (bearish) for quick directional insight.
🔹 Upper/Lower Bands: Help detect potential overbought/oversold conditions or strong trend continuation.
🔹 Zero Line Reference: A horizontal baseline at zero helps identify trend reversals and neutral zones.
🛠️ How to Use
✅ Spread > 0: Indicates a bullish trend. Consider maintaining or entering long positions.
✅ Spread < 0: Indicates a bearish trend. Consider maintaining or entering short positions.
⚠️ Spread exceeds bands: May signal overextension or strong momentum; consider using with additional confirmation indicators.
🔄 Band convergence: Suggests weakening trend and potential transition to a ranging market.
Recommended timeframes: 1H, 4H, Daily
Suggested complementary indicators: RSI, MACD, OBV, SuperTrend
✅ TradingView House Rules Compliance
This script is open-source and published under Pine Script v5.
It does not repaint, spam alerts, or cause performance issues.
It is designed as an analytical aid only and should not be considered financial advice.
All calculations are transparent, and no external data sources or insecure functions are used.
====================================================================
📌 Trend Band Oscillator
📄 설명 (Description)
Trend Band Oscillator는 두 개의 EMA 간 스프레드(차이)를 기반으로 한 모멘텀 중심의 추세 오실레이터입니다. 여기에 표준편차 기반의 변동성 밴드를 적용하여, 추세의 방향뿐 아니라 강도와 안정성까지 시각적으로 분석할 수 있도록 설계되었습니다.
📌 주요 특징 (Features)
🔹 EMA 기반 스프레드 계산: Fast EMA와 Slow EMA의 차이를 활용해 시장 추세를 정량적으로 표현합니다.
🔹 표준편차 필터링: Spread에 대해 EMA 및 표준편차 기반의 밴드를 적용해 노이즈를 줄이고 유효한 추세를 강조합니다.
🔹 컬러 기반 시각화: 오실레이터 값이 양수일 경우 초록색, 음수일 경우 마젠타 색으로 추세 방향을 직관적으로 파악할 수 있습니다.
🔹 밴드 범위 시각화: 상·하위 밴드를 통해 스프레드의 평균 편차 범위를 보여주며, 추세의 강약과 포화 여부를 진단할 수 있습니다.
🔹 제로 라인 표시: 추세 전환 가능 지점을 시각적으로 확인할 수 있도록 중심선(0선)을 제공합니다.
🛠️ 사용법 (How to Use)
✅ 오실레이터가 0 이상 유지: 상승 추세 구간이며, 롱 포지션 유지 또는 진입 검토
✅ 오실레이터가 0 이하 유지: 하락 추세 구간이며, 숏 포지션 유지 또는 진입 검토
⚠️ 상·하위 밴드를 이탈: 일시적인 과매수/과매도 혹은 강한 추세 발현 가능성 있음 → 다른 보조지표와 함께 필터링 권장
🔄 밴드 수렴: 추세가 약해지고 있음을 나타냄 → 변동성 하락 또는 방향성 상실 가능성 있음
권장 적용 시간대: 1시간봉, 4시간봉, 일봉
보조 적용 지표: RSI, MACD, OBV, SuperTrend 등과 함께 사용 시 신호 필터링에 유리
✅ 트레이딩뷰 하우스룰 준수사항 (TV House Rules Compliance)
이 지표는 **무료 공개용(Open-Source)**이며, Pine Script Version 5로 작성되어 있습니다.
과도한 리페인트, 비정상적 반복 경고(alert spam), 실시간 성능 저하 등의 요소는 포함되어 있지 않습니다.
사용자는 본 지표를 투자 결정의 참고용 보조 도구로 활용해야 하며, 독립적인 매매 판단이 필요합니다.
데이터 소스 및 계산 방식은 완전히 공개되어 있으며, 외부 API나 보안 취약점을 유발하는 구성 요소는 없습니다.

H BollingerBollinger Bands are a widely used technical analysis indicator that helps spot relative price highs and lows. The tool comprises three lines: a central band representing the 20-period simple moving average (SMA), and upper and lower bands usually placed two standard deviations above and below the SMA. These bands adjust with market volatility, offering insights into price fluctuations and trading conditions.
How this indicator works
Bollinger Bands helps traders assess price volatility and potential price reversals. They consist of three bands: the middle band, the upper band, and the lower band. Here's how Bollinger Bands work:
Middle band: This is typically a simple moving average (SMA) of the asset's price over a specified period. The most common period used is 20 days.
Upper band: This is calculated by adding a specified number of standard deviations to the middle band. The standard deviation measures the asset's price volatility. Commonly, two standard deviations are added to the middle band.
Lower band: Similar to the upper band, it is calculated by subtracting a specified number of standard deviations from the middle band.
What do Bollinger Bands tell you?
Bollinger bands primarily indicate the level of market volatility and trading opportunities. Narrow bands indicate low market volatility, while wide bands suggest high market volatility. Bollinger bands indicators can be used by traders to assess potential buy or sell signals. For instance, a sell signal may be interpreted or generated if the asset’s price moves closer or crosses the upper band, as it may indicate that the asset is overbought. Alternatively, a buy signal may be interpreted or generated if the price moves closer to the lower band, as it may signify that the asset is oversold.
However, traders should be cautious when using Bollinger Bands as standalone indicators when making trading decisions. Experienced traders refrain from confirming signals based on one indicator. Instead, they generally combine various technical indicators and fundamental analysis methods to make informed trading decisions. Basing trading decisions on only one indicator can result in misinterpretation of signals and heavy losses.
Bollinger Bands assist in identifying whether prices are relatively high or low. They are applied as a pair—upper and lower bands—alongside a moving average. However, these bands are not designed to be used in isolation. Instead, they should be used to validate signals generated by other technical indicators.
Calculation of Bollinger Band

Faytterro Bands Breakout📌 Faytterro Bands Breakout 📌
This indicator was created as a strategy showcase for another script: Faytterro Bands
It’s meant to demonstrate a simple breakout strategy based on Faytterro Bands logic and includes performance tracking.
❓ What Is It?
This script is a visual breakout strategy based on a custom moving average and dynamic deviation bands, similar in concept to Bollinger Bands but with unique smoothing (centered regression) and performance features.
🔍 What Does It Do?
Detects breakouts above or below the Faytterro Band.
Plots visual trade entries and exits.
Labels each trade with percentage return.
Draws profit/loss lines for every trade.
Shows cumulative performance (compounded return).
Displays key metrics in the top-right corner:
Total Return
Win Rate
Total Trades
Number of Wins / Losses
🛠 How Does It Work?
Bullish Breakout: When price crosses above the upper band and stays above the midline.
Bearish Breakout: When price crosses below the lower band and stays below the midline.
Each trade is held until breakout invalidation, not a fixed TP/SL.
Trades are compounded, i.e., profits stack up realistically over time.
📈 Best Use Cases:
For traders who want to experiment with breakout strategies.
For visual learners who want to study past breakouts with performance metrics.
As a template to develop your own logic on top of Faytterro Bands.
⚠ Notes:
This is a strategy-like visual indicator, not an automated backtest.
It doesn't use strategy.* commands, so you can still use alerts and visuals.
You can tweak the logic to create your own backtest-ready strategy.
Unlike the original Faytterro Bands, this script does not repaint and is fully stable on closed candles.

Bollinger Band + RSI Strategy ScannerVrushaNilansh Indicator for 15min. Trading Based on Bollinger Bands+RSI

RSI-BBGun-v6.1RSI BB Gun – Operator's Guide
“Eyes on target. Wait for the right moment. Then strike.”
________________________________________
🎯 Mission Objective
RSI BB Gun identifies extreme market conditions using RSI and Bollinger Bands, then overlays trend and volatility intelligence so you know when the setup is real.
The ❌ is your target acquisition signal—price just moved from an extreme zone back into play. Now you’ve got a clean radar lock.
________________________________________
📡 How to Operate
🟣 Step 1: Watch for the ❌'s (Black X = RSI & Bollinger Band Extremes Encountered)
• The Purple X means price and RSI are both stretched—and just snapped back into range.
• The target is now in the cross hairs and potentially ready for engagement.
🟥 Step 2: Confirm the Trend
• The thick ribbon tells you if the trend is with you:
o 🟢 Green = Uptrend. Focus on long setups.
o 🔴 Red = Downtrend. Focus on puts or short plays.
• Align with trend. Only engage when the field favors your position.
🔺 Step 3: Evaluate Signal Context
• Green Triangles = price just crossed below lower Bollinger Band (oversold).
• Red Triangles = price crossed above upper Band (overbought).
• Horizontal Lines Disappeared = The bar after the green or red horizontal line disappears means its time. We patiently wait for this as it means the momentum may be changing.
• These are your early indicators—they scout the setup on the GO / NO GO DECISION.
• ❌ + triangle + trend = clean shot.
________________________________________
☁️ Avoid These Situations
• ❌ in a choppy/no-trend zone = false alarm. Don’t engage.
• Repeated black ❌s without a purple ❌confirmation = low conviction. Let it go.
________________________________________
________________________________________
🪖 Operator's Mindset
“You don’t chase trades. You stalk them. When the ❌ flashes, the system has found a target. What you do next is up to your discipline, your tools, and your plan.”
________________________________________
Note: This is a free version. Upcoming paid version includes multi-timeframes working together. Multiple strategies. Volatility meter. Make money and master the BB Gun so that you can elevate to the Snipers weapon.
🔒 Want More Firepower?
Upgraded version coming soon. Unlocks next-gen targeting tools:
• Multi-timeframe RSI intelligence in a live dashboard
• Precision-timed combo signals based on layered volatility + RSI logic
• Advanced trend filters, trade zone overlays, and sniper-level entry indicators
• Ideal for swing traders and options strategists who want clarity under pressure
💥 Budget-friendly. No subscription. Upgrade when you're ready to go Pro.
Tip: Make 4+ trades mastering this setup. Then use a small portion of the trades to gain more features. Always be in a position you cannot lose.
🆚 Why This Beats Standard RSI/BB Tools
Mission Feature Basic Indicators RSI Ribbon Lite
Trend Confirmation ❌ ✅ Ribbon Overlay
Multi-Timeframe Awareness ❌ ✅ 5-Timeframe RSI Grid
Volatility Confirmation ❌ ✅ Weighted ATR Scoring
Combo Signal Alerts ❌ ✅ ❌ Reentry Combo Alerts
TradingView Alerts ❌ ✅ Built-In Radar Ping
#rsi #bb #bollingerbands #hull ma #trend

Volatility & Momentum Nexus (VMN)Volatility & Momentum Nexus (VMN)
This indicator was designed to solve a common trader's problem: chart clutter from dozens of indicators that often contradict each other. The Volatility & Momentum Nexus ( VMN ) is not just another indicator; it's a complete analysis system that synthesizes four essential market pillars into a single, clean, and intuitive visual signal.
The goal of VMN is to identify high-probability moments where a period of accumulation (low volatility) is about to erupt into an explosive move, confirmed by trend, momentum, and volume.
VMN analyzes the real-time confluence of four critical elements:
The Trend (The Main Filter): A 100-period Exponential Moving Average (EMA) sets the overall context. The indicator will only look for buy signals above this line (in an uptrend) and sell signals below it (in a downtrend). The line's color changes for quick visualization.
Volatility (Energy Accumulation): Using Bollinger Bands Width (BBW), the indicator identifies "Squeeze" periods—when the price contracts and builds up energy. These zones are marked with a yellow background on the chart, signaling that a major move is imminent.
Momentum (The Trigger): An RSI (Relative Strength Index) acts as the trigger. A signal is only validated if momentum confirms the direction of the breakout (e.g., RSI > 55 for a buy), ensuring we enter the market with force.
Volume (The Final Confirmation): No breakout move is credible without volume. VMN checks if the volume at the time of the signal is significantly higher than its recent average, adding a vital layer of confirmation.
Green Arrow (Buy Signal): Appears ONLY when ALL the following conditions are met simultaneously:
Price is above the 100 EMA (Bullish Trend).
The chart is exiting a Squeeze zone (yellow background on the previous bar).
Price breaks above the upper Bollinger Band.
RSI is above the buy threshold (default 55).
Volume is above average.
Red Arrow (Sell Signal): Appears ONLY when all the opposite conditions are met.
Do not treat signals as blind commands to trade. They are high-probability confirmations.
Look for signals near key Support/Resistance levels for an even higher success rate.
Always set a Stop Loss (e.g., below the low of the signal candle or below the lower Bollinger Band for a buy).
All parameters (EMA, RSI, Bollinger Bands lengths, thresholds, etc.) can be customized from the settings menu to adapt the indicator to any financial asset or timeframe.
Disclaimer: This indicator is a tool for educational and analytical purposes. It does not constitute and should not be interpreted as financial advice. Trading involves significant risk. Always perform your own analysis and backtesting before risking real capital.

[Mad]Triple Bollinger Bands ForecastTriple Bollinger Bands Forecast (BBx3+F)
This open-source indicator is an advanced version of the classic Bollinger Bands, designed to provide a more comprehensive and forward-looking view of market volatility and potential price levels.
It plots three distinct sets of Bollinger Bands and projects them into the future based on statistical calculations.
How It Is Built and Key Features
Triple Bollinger Bands: Instead of a single set of bands, this indicator plots three. All three share the same central basis line (a Simple Moving Average), but each has a different standard deviation multiplier. This creates three distinct volatility zones for analyzing price deviation from its mean.
Multi-Timeframe (MTF) Capability: The indicator can calculate and display Bollinger Bands from a higher timeframe (e.g., showing daily bands on a 4-hour chart). This allows for contextualizing price action within the volatility structure of a more significant trend.
(Lower HTF selection will result in script-crash!)
Future Forecasting: This is the indicator's main feature. It projects the calculated Bollinger Bands up to 8 bars into the future. This forecast is a recalculation of the Simple Moving Average and Standard Deviation based on a projected future source price.
Selectable Forecast Methods: The mathematical model for estimating the future source price can be selected:
Flat: A model that uses the most recent closing price as the price for all future bars in the calculation window.
Linreg (Linear Regression): A model that calculates a linear regression trend on the last few bars and projects it forward to estimate the future source price.
Efficient Drawing with Polylines: The future projections are drawn on the chart using Pine Script's polyline object. This is an efficient method that draws the forecast data only on the last bar, which avoids repainting issues.
Differences from a Classical Bollinger Bands Indicator
Band Count: A classical indicator shows one set of bands. This indicator plots three sets for a multi-layered view of volatility.
Perspective: Classical Bollinger Bands are purely historical. This indicator is both historical and forward-looking .
Forecasting: The classic version has no forecasting capability. This indicator projects the bands into the future .
Timeframe: The classic version works only on the current timeframe. This indicator has full Multi-Timeframe (MTF) support .
The Mathematics Behind the Future Predictions
The core challenge in forecasting Bollinger Bands is that a future band value depends on future prices, which are unknown. This indicator solves this by simulating a future price series. Here is the step-by-step logic:
Forecast the Source Price for the Next Bar
First, the indicator estimates what the price will be on the next bar.
Flat Method: The forecasted price is the current bar's closing price.
Price_forecast = close
Linreg Method: A linear regression is calculated on the last few bars and extrapolated one step forward.
Price_forecast = ta.linreg(close, linreglen, 1)
Calculate the Future SMA (Basis)
To calculate the Simple Moving Average for the next bar, a new data window is simulated. This window includes the new forecasted price and drops the oldest historical price. For a 1-bar forecast, the calculation is:
SMA_future = (Price_forecast + close + close + ... + close ) / length
Calculate the Future Standard Deviation
Similarly, the standard deviation for the next bar is calculated over this same simulated window of prices, using the new SMA_future as its mean.
// 1. Calculate the sum of squared differences from the new mean
d_f = Price_forecast - SMA_future
d_0 = close - SMA_future
// ... and so on for the rest of the window's prices
SumOfSquares = (d_f)^2 + (d_0)^2 + ... + (d_length-2)^2
// 2. Calculate future variance and then the standard deviation
Var_future = SumOfSquares / length
StDev_future = sqrt(Var_future)
Extending the Forecast (2 to 8 Bars)
For forecasts further into the future (e.g., 2 bars), the script uses the same single Price_forecast for all future steps in the calculation. For a 2-bar forecast, the simulated window effectively contains the forecasted price twice, while dropping the two oldest historical prices. This provides a statistically-grounded projection of where the Bollinger Bands are likely to form.
Usage as a Forecast Extension
This indicator's functionality is designed to be modular. It can be used in conjunction with as example Mad Triple Bollinger Bands MTF script to separate the rendering of historical data from the forward-looking forecast.
Configuration for Combined Use:
Add both the Mad Triple Bollinger Bands MTF and this Triple Bollinger Bands Forecast indicator to your chart.
Open the Settings for this indicator (BBx3+F).
In the 'General Settings' tab, disable the Activate Plotting option.
To ensure data consistency, the Bollinger Length, Multipliers, and Higher Timeframe settings should be identical across both indicators.
This configuration prevents the rendering of duplicate historical bands. The Mad Triple Bollinger Bands MTF script will be responsible for visualizing the historical and current bands, while this script will overlay only the forward-projected polyline data.

Bollinger Bands Levels | VTS Pro📊 Bollinger Bands Levels | VTS Pro
by Alireza Mossaheb
This advanced Bollinger Bands indicator takes your technical analysis to the next level by providing dynamic price bands along with customizable horizontal levels and labels. Whether you're a trend trader or a mean reversion strategist, this tool adapts to your workflow.
🔧 Key Features:
Three Modes: Choose between Strong (20, 2), Weak (10, 1.5), or Custom settings for full control.
Multi-Timeframe Support: Plot Bollinger Bands from any higher or lower timeframe.
Multiple MA Types: Select from SMA, EMA, RMA (SMMA), WMA, and VWMA for the basis line.
Visual Enhancements:
Optional background fill between bands
Stylized horizontal lines with labels (Top/Mid/Low)
Customizable line style, width, and color
Smart Labeling: Automatically names levels based on timeframe and mode.
Improved Plot Logic: Line width bug fixed for smoother rendering across presets.
🧠 Ideal For:
Spotting volatility squeezes or expansions
Confirming support/resistance with upper/lower bands
Creating confluence zones using higher timeframe Bollinger levels

OBV with MA & Bollinger Bands by Marius1032OBV with MA & Bollinger Bands by Marius1032
This script adds customizable moving averages and Bollinger Bands to the classic OBV (On Balance Volume) indicator. It helps identify volume-driven momentum and trend strength.
Features:
OBV-based trend tracking
Optional smoothing: SMA, EMA, RMA, WMA, VWMA
Optional Bollinger Bands with SMA
Potential Combinations and Trading Strategies:
Breakouts: Look for price breakouts from the Bollinger Bands, and confirm with a rising OBV for an uptrend or falling OBV for a downtrend.
Trend Reversals: When the price touches a Bollinger Band, examine the OBV for divergence. A bullish divergence (price lower low, OBV higher low) near the lower band could signal a reversal.
Volume Confirmation: Use OBV to confirm the strength of the trend indicated by Bollinger Bands. For example, if the BBs indicate an uptrend and OBV is also rising, it reinforces the bullish signal.
1. On-Balance Volume (OBV):
Purpose: OBV is a momentum indicator that uses volume flow to predict price movements.
Calculation: Volume is added on up days and subtracted on down days.
Interpretation: Rising OBV suggests potential upward price movement. Falling OBV suggests potential lower prices.
Divergence: Divergence between OBV and price can signal potential trend reversals.
2. Moving Average (MA):
Purpose: Moving Averages smooth price fluctuations and help identify trends.
Combination with OBV: Pairing OBV with MAs helps confirm trends and identify potential reversals. A crossover of the OBV line and its MA can signal a trend reversal or continuation.
3. Bollinger Bands (BB):
Purpose: BBs measure market volatility and help identify potential breakouts and trend reversals.
Structure: They consist of a moving average (typically 20-period) and two standard deviation bands.
Combination with OBV: Combining BBs with OBV allows for a multifaceted approach to market analysis. For example, a stock hitting the lower BB with a rising OBV could indicate accumulation and a potential upward reversal.
Created by: Marius1032

BB Oscillator - Price Relative to Bollinger BandsThis Bollinger Band Oscillator visualizes where the current price sits relative to its Bollinger Bands, scaled between 0 and 100. It helps identify overbought and oversold conditions based on the price’s position within the bands and provides dynamic signals when momentum shifts occur.
Features
Price Relative to Bollinger Bands
The main oscillator plots the price’s relative position within the Bollinger Bands on a scale from 0 (lower band) to 100 (upper band), giving an intuitive view of where price stands.
Customizable Moving Average Overlay
An optional moving average (SMA or EMA) smooths the oscillator for trend analysis, with adjustable length and color options.
Crossover & Crossunder Signals
Alerts and background highlights trigger when the oscillator crosses over or under its moving average, signaling potential momentum shifts or trend changes.
Fully Customizable Colors
Choose your preferred colors for the oscillator line, moving average and crossover signals to match your charting style.
This tool offers a unique oscillator view of Bollinger Bands, combining volatility context with momentum signals for clearer decision-making.

VWAP %BVWAP %B - Volume Weighted Average Price Percent B
The VWAP %B indicator combines the reliability of VWAP (Volume Weighted Average Price) with the analytical power of %B oscillators, similar to Bollinger Bands %B but using volume-weighted statistics.
## How It Works
This indicator calculates where the current price sits relative to VWAP-based standard deviation bands, expressed as a percentage from 0 to 1:
• **VWAP Calculation**: Uses volume-weighted average price as the center line
• **Standard Deviation Bands**: Creates upper and lower bands using standard deviation around VWAP
• **%B Formula**: %B = (Price - Lower Band) / (Upper Band - Lower Band)
## Key Levels & Interpretation
• **Above 1.0**: Price is trading above the upper VWAP band (strong bullish momentum)
• **0.8 - 1.0**: Overbought territory, potential resistance
• **0.5**: Price exactly at VWAP (equilibrium)
• **0.2 - 0.0**: Oversold territory, potential support
• **Below 0.0**: Price is trading below the lower VWAP band (strong bearish momentum)
## Trading Applications
**Trend Following**: During strong trends, breaks above 1.0 or below 0.0 often signal continuation rather than reversal.
**Mean Reversion**: In ranging markets, extreme readings (>0.8 or <0.2) may indicate potential reversal points.
**Volume Context**: Unlike traditional %B, this incorporates volume weighting, making it more reliable during high-volume periods.
## Parameters
• **Length (20)**: Period for standard deviation calculation
• **Standard Deviation Multiplier (2.0)**: Controls band width
• **Source (close)**: Price input for calculations
## Visual Features
• Reference lines at key levels (0, 0.2, 0.5, 0.8, 1.0)
• Background highlighting for extreme breaks
• Real-time values table
• Clean oscillator format below price chart
Perfect for intraday traders and swing traders who want to combine volume analysis with momentum oscillators.

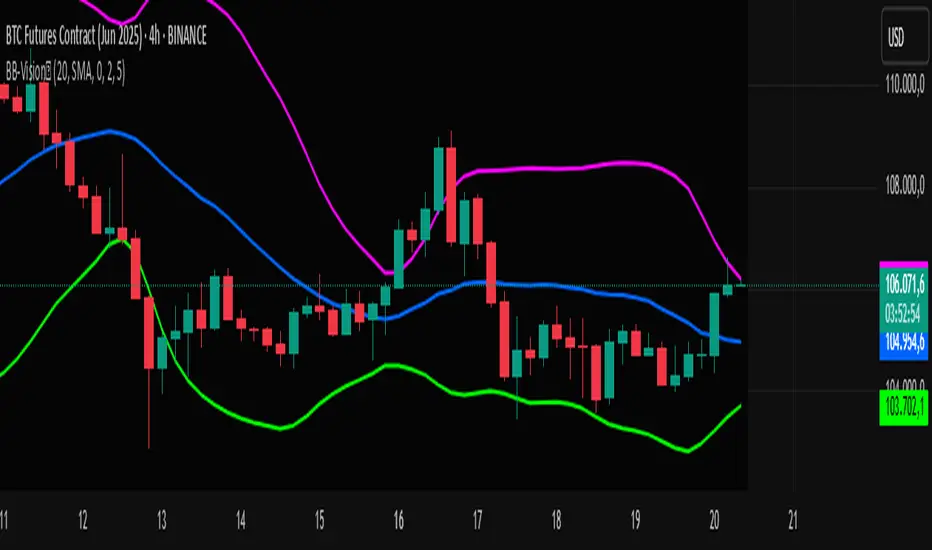
Bands Vision-XBands Vision-X (BB-Vision-X) – Full Description
Description:
Bands Vision-X is an indicator based on dynamic bands constructed from customizable moving averages and standard deviation, allowing you to visualize potential support and resistance zones, volatility, and market conditions. It uses an adjustable moving average (with multiple options such as SMA, EMA, WMA, JMA, LSMA, DEMA, and TEMA) to define the central line, and upper and lower bands calculated by standard deviation multiplied by an adjustable factor. The bands are smoothed by a Hull Moving Average (HMA) to reduce noise and improve clarity.
How to Use
The bands indicate potential support and resistance levels.
The central line serves as a dynamic price reference.
The distance between bands reflects market volatility.
Touches or breakouts of the bands may signal entry or exit opportunities.
Parameters
Parameter Description Default
Standard Error Band Period Period for moving average and standard deviation 20
Moving Average Type Type of moving average (SMA, EMA, etc.) SMA
Standard Deviation Multiplier Multiplier for standard deviation 2.0
Band Lines Smoothing Period Period for smoothing the bands (HMA) 5
Technical Notes
The JMA function used is not the original Jurik version but an approximate and open implementation based on publicly available TradingView community code.
Developed in Pine Script v6 with optimized and clean code.
Recommendations
Ideal for traders seeking a clear view of volatility and dynamic support/resistance levels.
Should not be used in isolation; it is recommended to combine with volume analysis, price action, or other technical indicators.
Adjust the period and multiplier according to the asset and timeframe for better effectiveness.
5EMA_BB_ScalpingWhat?
In this forum we have earlier published a public scanner called 5EMA BollingerBand Nifty Stock Scanner , which is getting appreciated by the community. That works on top-40 stocks of NSE as a scanner.
Whereas this time, we have come up with the similar concept as a stand-alone indicator which can be applied for any chart, for any timeframe to reap the benifit of reversal trading.
How it works?
This is essentially a reversal/divergence trading strategy, based on a widely used strategy of Power-of-Stocks 5EMA.
To know the divergence from 5-EMA we just check if the high of the candle (on closing) is below the 5-EMA. Then we check if the closing is inside the Bollinger Band (BB). That's a Buy signal. SL: low of the candle, T: middle and higher BB.
Just opposite for selling. 5-EMA low should be above 5-EMA and closing should be inside BB (lesser than BB higher level). That's a Sell signal. SL: high of the candle, T: middle and lower BB.
Along with we compare the current bar's volume with the last-20 bar VWMA (volume weighted moving average) to determine if the volume is high or low.
Present bar's volume is compared with the previous bar's volume to know if it's rising or falling.
VWAP is also determined using `ta.vwap` built-in support of TradingView.
The Bolling Band width is also notified, along with whether it is rising or falling (comparing with previous candle).
What's special?
We love this reversal trading, as it offers many benifits over trend following strategies:
Risk to Reward (RR) is superior.
It _Does Hit_ stop losses, but the stop losses are tiny.
Means, althrough the Profit Factor looks Nahh , however due to superior RR, end of day it ended up in green.
When the day is sideways, it's difficult to trade in trending strategies. This sort of volatility, reversal strategies works better.
It's always tempting to go agaist the wind. Whole world is in Put/PE and you went opposite and enter a Call/CE. And turns out profitable! That's an amazing feeling, as a trader :)
How to trade using this?
* Put any chart
* Apply this screener from Indicators (shortcut to launch indicators is just type / in your keyboard).
* It will show you the Green up arrow when buy alert comes or red down arrow when sell comes. * Also on the top right it will show the latest signal with entry, SL and target.
Disclaimer
* This piece of software does not come up with any warrantee or any rights of not changing it over the future course of time.
* We are not responsible for any trading/investment decision you are taking out of the outcome of this indicator.

Mitsos4 RSI + BB + Dispersion + Trendlines + VIX Fix Mitsos4 RSI + BB + Dispersion + Trendlines + VIX Fix
This powerful custom indicator combines two analytical tools into one view:
RSI-based Bollinger Bands with Dispersion and the Vix Fix volatility spike detector.
It is designed for traders who want early volatility signals and precision RSI insights, all in a single pane.
🧩 What's Included:
✅ 1. RSI + BB (EMA) + Dispersion
RSI-Based Bollinger Bands: Tracks the RSI with Bollinger Bands using an EMA as the basis.
Dispersion Zone: A buffer zone around the moving average band for more sensitive overbought/oversold detection.
Dynamic RSI Coloring:
🟢 Green: RSI breaks above the dispersion zone.
🔴 Red: RSI breaks below the dispersion zone.
🟡 Yellow: RSI inside the zone (neutral).
Trendlines at RSI levels: 40 (green), 50 (yellow), 60 (red).
Alerts when RSI crosses dispersion zones.
✅ 2. CM_Williams_Vix_Fix
Designed to simulate VIX-like volatility spikes on non-VIX instruments.
Detects potential market bottoms by measuring price deviation from recent highs.
Includes:
Bollinger Band range on WVF.
Percentile high/low zones to detect significant volatility moves.
Histogram plot of WVF for quick visual alerts.
Color-coded spikes (green when above upper thresholds).
⚙️ User Controls:
Adjustable RSI, Bollinger Band, and dispersion settings.
Toggle options for:
Viewing high/low VIX percentiles.
Showing standard deviation bands for WVF.
Custom trendline display levels at RSI key areas.
📌 Best Use Cases:
Detect early market reversals and volatility spikes.
Combine RSI strength with volatility-based bottom signals.
Layer dispersion-based logic on top of classic RSI strategies.

MACD + RSI + EMA + BB + ATR Day Trading StrategyEntry Conditions and Signals
The strategy implements a multi-layered filtering approach to entry conditions, requiring alignment across technical indicators, timeframes, and market conditions .
Long Entry Requirements
Trend Filter: Fast EMA (9) must be above Slow EMA (21), price must be above Fast EMA, and higher timeframe must confirm uptrend
MACD Signal: MACD line crosses above signal line, indicating increasing bullish momentum
RSI Condition: RSI below 70 (not overbought) but above 40 (showing momentum)
Volume & Volatility: Current volume exceeds 1.2x 20-period average and ATR shows sufficient market movement
Time Filter: Trading occurs during optimal hours (9:30-11:30 AM ET) when market volatility is typically highest
Exit Strategies
The strategy employs multiple exit mechanisms to adapt to changing market conditions and protect profits :
Stop Loss Management
Initial Stop: Placed at 2.0x ATR from entry price, adapting to current market volatility
Trailing Stop: 1.5x ATR trailing stop that moves up (for longs) or down (for shorts) as price moves favorably
Time-Based Exits: All positions closed by end of trading day (4:00 PM ET) to avoid overnight risk
Best Practices for Implementation
Settings
Chart Setup: 5-minute timeframe for execution with 15-minute chart for trend confirmation
Session Times: Focus on 9:30-11:30 AM ET trading for highest volatility and opportunity

Bollinger Bands - Multi Symbol Alert (Miu)This script extends the classic Bollinger Bands indicator with support for up to 8 user-defined symbols and a unique alert system.
Unlike traditional Bollinger Band indicators, it allows traders to configure alerts across multiple assets without keeping the indicator visible on the chart, making it ideal for passive multi-asset monitoring.
What it does:
This script calculates Bollinger Bands using a 100-period simple moving average and a standard deviation multiplier of 3 (or any input you set in the settings panel).
For each selected symbol, the upper and lower bands are retrieved using request.security() and monitored for breakouts.
Alerts are triggered when the closing price of the selected symbol breaks above the upper band (Overbought) or below the lower band (Oversold) — at the bar close.
How to use it:
1) Add the indicator to your chart.
2) Open the settings panel.
3) Select up to 8 symbols to monitor.
4) After setting parameters, click the three dots next to the indicator title and choose "Add Alert on...".
5) Name your alert and confirm.
6) If you don’t wish to keep the indicator visible, you can remove it from the chart — alerts will still function as expected.
Alert message includes:
- Symbol name (e.g., BTC, ETH, LTC)
- (OB) for overbought or (OS) for oversold
- Symbol’s price at the alert moment
Technical note:
This script uses request.security() to fetch Bollinger Band levels and closing prices from up to 8 selected symbols in real time.
Feel free to leave your feedback or suggestions in the comments section below.
Enjoy!
Dual Stochastic Enhanced (with Presets giua64)Script Title: Dual Stochastic Enhanced (with Presets giua64)
Overview:
This indicator enhances the traditional Dual Stochastic strategy, aiming to provide more filtered and potentially reliable trading signals. By integrating dynamic overbought/oversold levels via Bollinger Bands on the slow stochastic, a trend filter based on a moving average, momentum confirmation via RSI, and user-friendly selectable presets, "Dual Stochastic Enhanced" seeks to offer a more robust approach to identifying potential entry points.
Key Features:
Dual Stochastics: Utilizes a slow stochastic (configurable, e.g., 14 periods) as a context filter and a fast stochastic (configurable, e.g., 5 periods) as a signal trigger.
Bollinger Bands on Slow Stochastic: Instead of fixed overbought/oversold levels (80/20), Bollinger Bands are applied to the %K line of the slow stochastic. This creates dynamic zones that adapt to the stochastic's own volatility.
Trend Filter: A moving average (configurable type and length, e.g., EMA 100 as seen in the example chart for general context) on the price helps filter signals, allowing only trades aligned with the prevailing trend.
RSI Confirmation: An RSI oscillator (configurable length, e.g., 14 periods) is used to confirm momentum. Signals require the RSI to cross certain thresholds to validate the strength of the move.
User Presets: Includes presets for "Scalping," "Intraday," and "Swing trading," which quickly set all key parameters to suit different styles and timeframes. A "Custom" option is also available for full manual configuration.
Clear Visual Signals: Long (green) and Short (red) arrows appear on the chart when all entry conditions are met.
Active Zone Highlighting: The background of the indicator panel changes color (green or red) when "active zone" conditions (a combination of stochastics, trend, and RSI) are favorable.
Information Panel: A table in the top-right corner of the indicator panel displays the current status of the selected preset, trend filter, RSI value, and stochastic levels.
Signal Logic:
A LONG signal is generated when:
The fast stochastic %K crosses above its %D line.
The slow stochastic %K line is below its lower Bollinger Band (dynamic oversold condition).
The fast stochastic %K line is also in a low area (e.g., <25) to confirm the trigger is not premature.
The closing price is above the trend moving average (uptrend).
The RSI is above its long confirmation level (e.g., >40), indicating sufficient bullish momentum.
A SHORT signal is generated when:
The fast stochastic %K crosses below its %D line.
The slow stochastic %K line is above its upper Bollinger Band (dynamic overbought condition).
The fast stochastic %K line is also in a high area (e.g., >75).
The closing price is below the trend moving average (downtrend).
The RSI is below its short confirmation level (e.g., <60), indicating sufficient bearish momentum.
How to Use:
Select a Preset suitable for your trading style and the timeframe you are analyzing (e.g., Scalping for M1-M15, Intraday for M5-H1, Swing for H4-D1).
Alternatively, choose "Custom" and manually adjust all parameters (stochastic lengths, smoothing, Bollinger Bands, Moving Average, RSI, confirmation thresholds).
Observe the Information Panel for a quick understanding of the current conditions.
Evaluate the arrow signals, always considering the broader market context, price action, and any other confluences (supports/resistances, chart patterns).
The background highlighting can help quickly identify periods where conditions are aligned for potential trades.
Disclaimer:
This script is provided for educational and informational purposes only. Trading involves significant risk, and past performance is not indicative of future results. Always thoroughly test any strategy or indicator on historical data and on a demo account before risking real capital. The author assumes no responsibility for any losses incurred from the use of this script.
Author: giua64

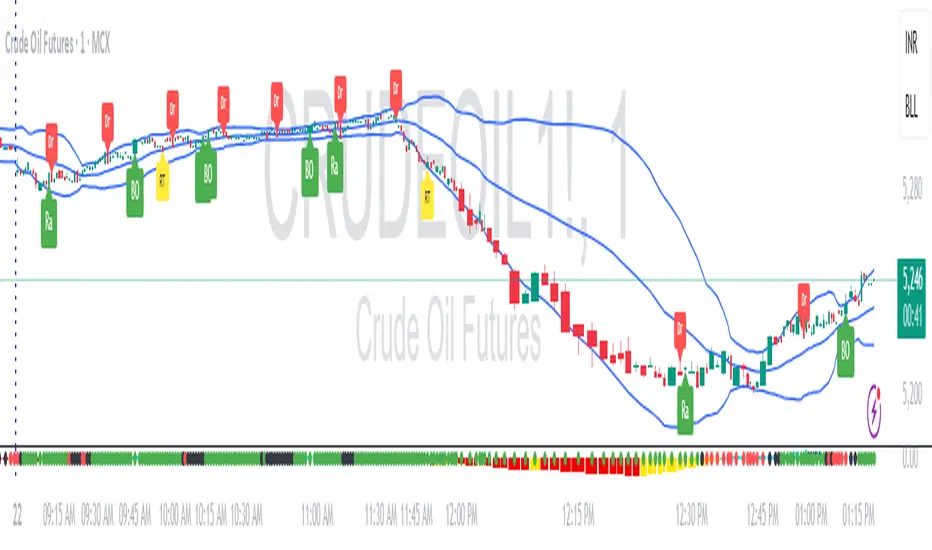
RDBRB Strategy with Filters + Cooldowns + LabelsRDBRB Strategy with Filters + Cooldowns
This script implements the RDBRB (Rally-Drop-Base-Retest-Breakout) strategy, a classic price action setup designed to identify structured trade opportunities using volume, volatility bands, and trend alignment. It’s ideal for traders looking for clean, rule-based entries across any timeframe.
🧠 Core Components
Rally & Drop Detection
Identifies short-term momentum shifts using moving average crossovers:
✅ Ra = Rally (bullish crossover)
🔻 Dr = Drop (bearish crossunder)
Base Formation
A statistical base is defined using a moving average with a standard deviation envelope (Upper/Lower BB). This forms the foundation for breakout or retest setups.
Retest Zone (RT)
When price returns to the lower band (but stays below the base), it suggests a potential re-accumulation or reaction zone before a breakout.
Breakout Confirmation (BO)
A breakout is validated when:
Price crosses above the upper band
Volume exceeds the 20-bar average by a threshold multiplier
RSI is above a bullish momentum level
Price is trending above the longer-term EMA
⏱️ Smart Cooldown Logic
Each signal (Rally, Drop, Retest, Breakout) has an independent cooldown timer to prevent multiple triggers within a short range, filtering out noise and duplicate signals:
Customizable cooldown periods via input settings
Ensures signals are meaningful and not clustered
💡 Visual Markers
All signals are shown as small, color-coded labels:
Ra : Green label below bar
Dr : Red label above bar
RT : Yellow label below bar
BO : Green breakout label below bar
Bands and base are plotted for structure reference.
🛠️ Customizable Settings
Cooldown periods for each signal type
MA lengths, volume and RSI thresholds
Trend filter and base calculation inputs
This script is ideal for price action traders who want a clean, structured method to trade consolidations and trend continuations while avoiding over-signaling. Use it on any timeframe and combine with higher-timeframe confirmation for best results.
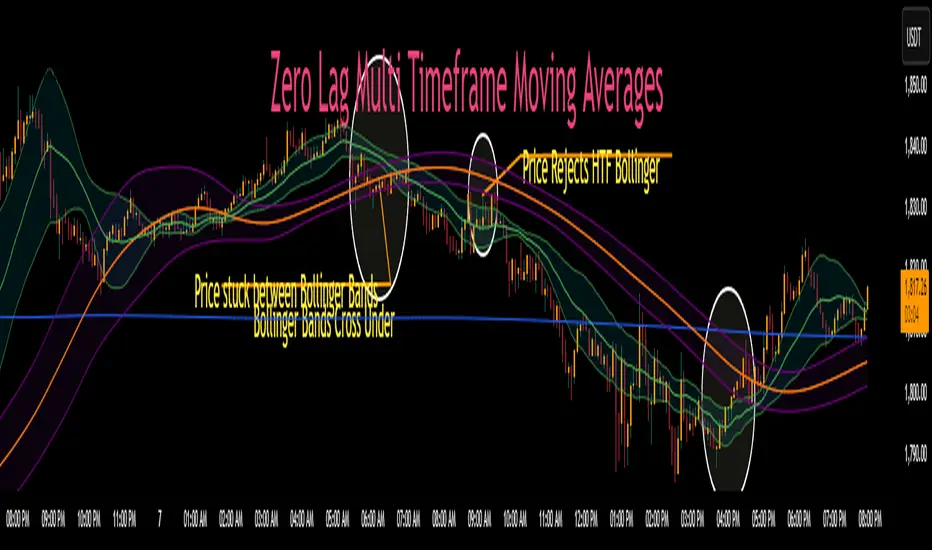
Zero Lag MTF Moving Average by CoffeeshopCryptoBased on Moving Average Types supplied by @TradingView www.tradingview.com
Ideas and code enhanced to show higher timeframe by @CoffeeShopCrypto
It’s time to take the guesswork out of moving averages and multiple timeframes when day trading. Moving averages are a cornerstone of many trading strategies, often viewed as dynamic support and resistance levels. Traders rely on these levels to anticipate price reactions, whether it’s a bounce in a trending market or a reversal in a ranging one. Additionally, the direction and alignment of multi timeframe moving averages—whether they’re moving in the same direction or diverging—provide critical clues about market momentum and potential reversals. However, the traditional higher timeframe moving average indicators force traders to wait for higher timeframe candles to close, creating lag and missed opportunities.
The Old Way
For example: If you are on a 5 minute chart and you want to observe the location and direction of a 30 minute chart Moving Average, you'll need to wait for a total of 6 candles to close, and again every 6 candles after that. This only creates more lag.
The New Way
Now there is no waiting for high timeframe session candles to close. No matter what timeframe Moving Average you want to know about, this indicator will show you its location on your current chart at any time in real time.
For those who prefer Bollinger Bands, this indicator adds a whole new dimension to your strategy. Traders often wait for price action to break outside the lower time frame Bollinger bands before considering a trade, while still seeking key support or resistance levels beyond them. But if you don't know the position of your higher time frame Bollinger, you could be trading into a trap. With Zero Lag Multi Timeframe Moving Average, you can view both your current and higher timeframe Bollinger Bands simultaneously with zero waiting. This lets you instantly see when price action is traveling between the bands of either timeframe or breaking through both—indicating a strong trend in that direction. Additionally, when both sets of Bollinger Bands overlap at the same price levels, it highlights areas of strong consolidation and ranging conditions, giving you a clear picture of market dynamics. This is a key element in price action that tells you there is currently no direction to the market and both the current and higher time frames are flat.
Enter Zero Lag Multi Timeframe Moving Average—the ultimate tool for real-time higher timeframe moving averages and Bollinger Bands. This innovative indicator eliminates the delay, delivering instant, precise values for higher timeframe averages and bands, even on open candles. Seamlessly combining current and higher timeframe data, it allows traders to identify key moments where moving averages or Bollinger Bands align or diverge, signaling market conditions. Whether you’re gauging the strength of a trend, pinpointing potential reversals, or identifying consolidation zones, Zero Lag Multi Timeframe Moving Average gives you the clarity needed to make better trading decisions according to market conditions.
Why is this "Mashup" of moving averages different and important?
Honestly its really about the calculation thats imported through the "import library" function.
Heres what it does:
The ZLMTF-MA is designed to help traders easily see where higher timeframe moving averages and Bollinger Bands are—without needing to switch chart timeframes or wait for those larger candles to close. It works by adjusting common moving average types like SMA, EMA, and VWMA to show what they would look like if they were based on a higher timeframe, right on your current chart. This helps users stay focused on their main timeframe while still having a clear view of the bigger picture, making it easier to spot trend direction, key support and resistance levels, and overall market structure. The goal is to keep things simple, fast, and more visually informative for everyday traders.
Bollinger Bands
When working with Bollinger Bands, a common strategy is to take the trades once price action has escaped through the top or bottom of your current Bollinger Band.
A false breakout occurs when both Bollinger Bands are not moving in the same direction as eachother or when they are overlapping.
Moving Averages as Support and Resistance:
Traders who use Moving Averages as support or resistance, looking for rejections or failures of these areas can now see multiple timeframe price action instantly and simultaneously.
Trading Setup Examples:
Price Action Scenario 1:
Higher Timeframe Ranging-
When price action breaks through a current moving average headed toward a higher timeframe moving average, trades are taken with caution if the moving averages are converging.
Price Action Scenario 2:
Strong Trending Market -
If the moving averages are in the same direction, and your price action is now leading the low timeframe moving average, you have re-entered a strong trend.
Price Action Scenario 3:
High Timeframe Rejections -
If you have a rejection of a higher timeframe moving average, and your both averages are still diverging, this is the end of a pullback as you re-enter a strong trend in the original direction
Price Action Scenario 4:
Trend Reversals -
If you close beyond both the low and high timeframe moving averages, you can consider that price action is strong enough to change direction here and you should prepare for trade setups in the opposite direction of the previous.
HTF MA Label Information:
Even if your high timeframe moving average is turned off, you can still see this label.
It gives you a quick reminder of what high timeframe settings you have used to see MA values.
Atlas BBTlevelsAtlas BBTlevels is a custom Bollinger Bands-based indicator that measures the momentum and strength of price trends using the difference between short- and long-period Bollinger Bands. Inspired by John Bollinger’s official tools like BBTrend, %b, and Bandwidth, this script adds adjustable horizontal threshold levels so traders can mark important reaction zones on their charts.
It visualizes when markets may be entering overheated or exhausted conditions — either for trend continuation or potential reversals — and works across crypto, stocks, forex, spot, or perpetual charts.
How I personally use it:
I apply Atlas BBTlevels across three timeframes:
Low timeframe (LTF): 5m–15m
Mid timeframe (MTF): 1h–6h
High timeframe (HTF): 1d–2d
I review where the indicator historically spiked during major moves. For example, if the 4-hour chart shows repeated spikes to +10 or −10, I’ll set my positive and negative thresholds near those levels. This lets me anticipate zones where the market may reverse, cool off, or break out. I then compare LTF, MTF, and HTF levels to look for confluence. When multiple timeframes align near key levels, it gives me higher confidence to prepare for a trade — but I always combine this with price action and other confirmation tools.
How others can use it:
Identify overbought/oversold zones by adjusting the thresholds to match historical extremes on your chosen asset.
Use it as a trend strength gauge: when the histogram is near or above the top threshold, the trend is likely strong; when it fades back toward zero, momentum is weakening.
Watch for volatility expansions or contractions as the indicator accelerates away from or returns toward zero.
Combine it with price action (support/resistance, trendlines, chart patterns) or other momentum tools to reduce false signals.
Apply it across multiple timeframes to look for confluence — this increases reliability compared to using it on just one chart.
Important tips:
Positive spikes (above zero) usually indicate strength or overextension upward; negative spikes (below zero) show weakness or downward exhaustion.
You can reverse the color logic if you want (for example, highlight negative spikes as green for buy interest and positive spikes as red for sell interest) — this is just a visual preference.
This is not a standalone buy/sell system. Always combine it with other tools, market context, and risk management.

Bollinger Bands ETSOverview
Bollinger Bands ETstyle (BB ETS) is an advanced volatility and breakout detection indicator, building upon the classic Bollinger Bands. This script introduces adaptive ATR-based band width smoothing and clear squeeze detection, making it a versatile tool for traders seeking more responsive and actionable volatility analysis.
Features
Dual Bollinger Bands: Plots both standard and outer bands around a configurable moving average, allowing visualization of typical and extreme volatility ranges.
ATR-Based Band Smoothing (Optional): When enabled, the bands automatically widen during low-volatility periods using the Average True Range (ATR), reducing false signals and making the bands more adaptive.
Squeeze Detection (Optional): Highlights periods when the bands contract below a user-defined threshold, signaling potential breakout setups. Squeeze periods are visually marked with a background highlight for easy identification.
Customizable Settings: Users can adjust band length, standard deviation multipliers, ATR parameters, and squeeze thresholds. Both ATR smoothing and squeeze detection can be toggled on or off.
Clean Chart Output: The indicator overlays directly on price with clear, distinguishable visuals for all features.
How It Works
The indicator calculates a moving average (basis) and plots upper and lower bands at user-selected standard deviations.
If ATR smoothing is enabled, the band width expands by a multiple of the ATR, adapting to real-time volatility.
The script computes the relative band width ("bandwidth"). When this falls below your chosen threshold, the background is highlighted to indicate a "squeeze"-a period of reduced volatility that often precedes breakouts.
How to Use
Trend & Volatility Analysis: Use the bands to identify overbought/oversold conditions and current market volatility. Price touching or crossing the outer bands may signal trend exhaustion or continuation.
Breakout Anticipation: Watch for background highlights indicating a squeeze. These periods suggest the market is coiling for a potential significant move.
Adaptive Sensitivity: Enable ATR smoothing to keep bands relevant during both calm and volatile markets, reducing false signals in low-volatility conditions.
Customization: Adjust all parameters in the settings to match your trading style and the asset’s behavior.
Limitations
The indicator is designed for standard price charts and may not perform as intended on non-standard chart types (such as Renko or Heikin Ashi).
As with all technical tools, best results are achieved when used alongside other forms of analysis.
Summary
Bollinger Bands ETstyle (BB ETS) offers a modern, adaptive approach to volatility and breakout analysis by combining classic bands with ATR-based smoothing and clear squeeze visualization. It is suitable for trend-following and breakout strategies, and requires no additional scripts-simply apply to your chart and adjust the settings as needed.

BK AK-9I am incredibly proud to introduce my fourth indicator to the TradingView community:
BK AK-9 — a next-level momentum-volatility hybrid, built for traders who demand precision.
🔥 Why “AK-9”? The Meaning Behind the Name
This indicator is deeply personal to me.
The “AK” in the name represents the initials of my mentor — the man whose guidance shaped my journey in trading, discipline, and strategy.
His wisdom is woven into every line of code, every design choice, and every purpose behind this tool.
The “9” holds its own powerful meaning:
9 is the number of completion and breakthrough — the moment where preparation meets opportunity.
The AK-9 weapon itself is a suppressed variant of the legendary AK platform, built for stealth, precision, and maximum impact in close-quarters combat.
It’s quiet, adaptive, and deadly effective — just like this indicator cuts through market noise, adapts to volatility, and pinpoints moments of maximum opportunity.
✨ About the BK AK-9 Indicator
The BK AK-9 is not just an oscillator.
It’s a multi-layered trading weapon combining:
✅ RSI → Stochastic → Bollinger Bands on Stoch RSI → momentum measured inside volatility.
✅ Dynamic or Static Background Flash → when extremes hit, you get instant visual alerts.
✅ Color-coded %K zones →
🔴 Red: oversold
🟢 Green: overbought
🔵 Blue: neutral
✅ Volatility-adaptive bands → instead of relying on static levels, the bands expand and contract dynamically using standard deviation.
🛡️ Why This Indicator Matters
Pinpoints exhaustion zones statistically, not emotionally.
Confirms breakouts with volatility evidence, not just price action.
Filters noise and helps you wait for high-probability setups.
Gives you visual edge with color-coded momentum and background flash.
Perfect for:
🔹 Breakout traders confirming momentum surges.
🔹 Mean-reversion traders catching exhaustion pivots.
🔹 Swing traders using multi-layered momentum analysis.
🔹 Momentum traders hunting volatility-backed entries.
💥 How to Use BK AK-9
Breakout Confirmation → when Stoch RSI breaks above upper Bollinger Band (green zone, flash ON), ride the trend.
Mean Reversion Trades → when Stoch RSI drops below lower Bollinger Band (red zone, flash ON), look for reversals.
Noise Filtering → stay patient inside the blue zone, wait for extremes.
Advanced Sync → align it with Gann levels, harmonic patterns, Fibonacci clusters, or Elliott waves for maximum edge.
🙏 Final Thoughts
This isn’t just another tool — it’s a weapon in your trading arsenal.
🔹 Dedicated to my mentor, A.K., whose wisdom and legacy guide my work.
🔹 Designed around the number 9, the number of completion, transition, and breakthrough.
🔹 Built to help traders act with precision, discipline, and clarity.
But above all, I give praise and glory to Gd — the true source of wisdom, insight, and success.
Markets will test your patience and your skill, but faith tests your soul. Through every challenge, every victory, and every setback, Gd remains the constant.
This tool is simply another way to use the gifts He has given — to help others rise.
⚡ Stay Ready, Stay Sharp
The markets are a battlefield. But with the right tools, the right strategy, and the right mindset — you will always stay 10 steps ahead.
🔥 Stay locked. Stay loaded. Trade with precision. 🔥
Gd bless, and may He guide us all to wisdom and success. 🙏
