OPEN-SOURCE SCRIPT
Aggiornato E9 ASIA Session
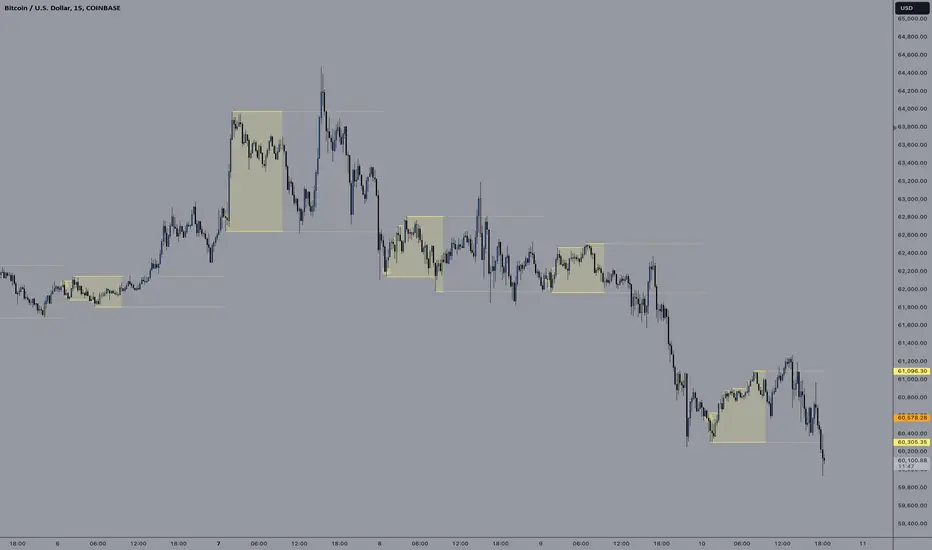
*note: Upon updating the script the conversion from V4 to v5 has lost the weekend extended lines and now prints an asia session for each day. It is recommended (esp for crypto) to extend these lines across the weekend like in the chart example above.
The E9 Asia Session Indicator is a valuable tool for traders aiming to track and analyze the Asia trading session on financial charts. This indicator provides insights into price behavior during the Asia session, which is crucial for making informed trading decisions. Here's an overview of its key functionalities and uses:
1. Session Highs and Lows
Purpose:
The indicator calculates and plots the high and low of the Asia session.
It helps identify key levels of support and resistance established during this trading period.
Importance:
These levels can act as significant reference points for future price movements.
Price action that occurs near these levels often provides clues about potential breakouts or reversals.
2. Session Background Color
Purpose:
The indicator can shade the background of the chart during the Asia session.
Importance:
This visual cue helps quickly identify the session's timeframe, enhancing the trader’s ability to observe price behavior within this specific period.
It aids in distinguishing between different trading sessions and understanding their influence on price action.
3. Start of Session Marker
Purpose:
A visual marker (such as a circle) is plotted at the beginning of each Asia session.
Importance:
This marker helps traders visually pinpoint the start of the session, making it easier to analyze how the price reacts from the session's opening.
4. End of Session Marker
Purpose:
A marker is plotted at the end of the Asia session, indicating where the session closes.
Importance:
This marker is useful for tracking the end of the session and observing price behavior around this critical juncture.
It helps in analyzing whether the session's high or low gets revisited or broken in subsequent sessions.
Practical Uses:
Strategic Planning: Traders can use the plotted high and low levels to set their trading strategies, stop-loss orders, and profit targets.
Market Analysis: Understanding how price interacts with the Asia session’s high and low levels can provide insights into market sentiment and potential price movements.
By incorporating the E9 Asia Session Indicator into your trading toolkit, you can gain a deeper understanding of the Asia session's impact on price dynamics, enhancing your overall trading strategy and decision-making process.
Disclaimer: The information contained in this article does not constitute financial advice or a solicitation to buy or sell any securities. All investments involve risk, and past performance does not guarantee future results. Always evaluate your financial circumstances and investment objectives before making trading decisions.
Note di rilascio
*Update: Time Period amended. *UTC times is now the timezone standard in settings.Script open-source
Nello spirito di TradingView, l'autore di questo script lo ha reso open source, in modo che i trader possano esaminarne e verificarne la funzionalità. Complimenti all'autore! Sebbene sia possibile utilizzarlo gratuitamente, ricordiamo che la ripubblicazione del codice è soggetta al nostro Regolamento.
Declinazione di responsabilità
Le informazioni e le pubblicazioni non sono intese come, e non costituiscono, consulenza o raccomandazioni finanziarie, di investimento, di trading o di altro tipo fornite o approvate da TradingView. Per ulteriori informazioni, consultare i Termini di utilizzo.
Script open-source
Nello spirito di TradingView, l'autore di questo script lo ha reso open source, in modo che i trader possano esaminarne e verificarne la funzionalità. Complimenti all'autore! Sebbene sia possibile utilizzarlo gratuitamente, ricordiamo che la ripubblicazione del codice è soggetta al nostro Regolamento.
Declinazione di responsabilità
Le informazioni e le pubblicazioni non sono intese come, e non costituiscono, consulenza o raccomandazioni finanziarie, di investimento, di trading o di altro tipo fornite o approvate da TradingView. Per ulteriori informazioni, consultare i Termini di utilizzo.