OPEN-SOURCE SCRIPT
0.382 Fibonacci Line of Trailing 1-year Price Range
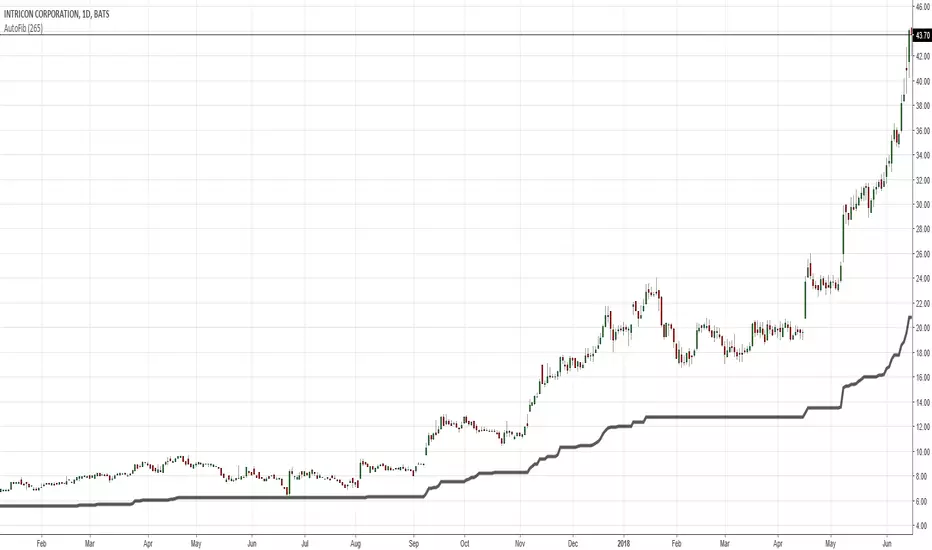
You may try adding this Line to your daily charts. It represents the 0.382 Fibonacci level of the trailing 1-year Price Range.
If price is above this line, then it is in Bullish Territory and long entries can be looked for.
According to backtesting I've done, price being above the 0.382 Fibonacci and/or the 200d sma are the 2 best determinants of
qualifying an equity to be in Bullish Territory on the daily chart.
If price is above this line, then it is in Bullish Territory and long entries can be looked for.
According to backtesting I've done, price being above the 0.382 Fibonacci and/or the 200d sma are the 2 best determinants of
qualifying an equity to be in Bullish Territory on the daily chart.
Script open-source
Nello spirito di TradingView, l'autore di questo script lo ha reso open source, in modo che i trader possano esaminarne e verificarne la funzionalità. Complimenti all'autore! Sebbene sia possibile utilizzarlo gratuitamente, ricordiamo che la ripubblicazione del codice è soggetta al nostro Regolamento.
Declinazione di responsabilità
Le informazioni e le pubblicazioni non sono intese come, e non costituiscono, consulenza o raccomandazioni finanziarie, di investimento, di trading o di altro tipo fornite o approvate da TradingView. Per ulteriori informazioni, consultare i Termini di utilizzo.