PROTECTED SOURCE SCRIPT
SPX IC Intraday & Stats
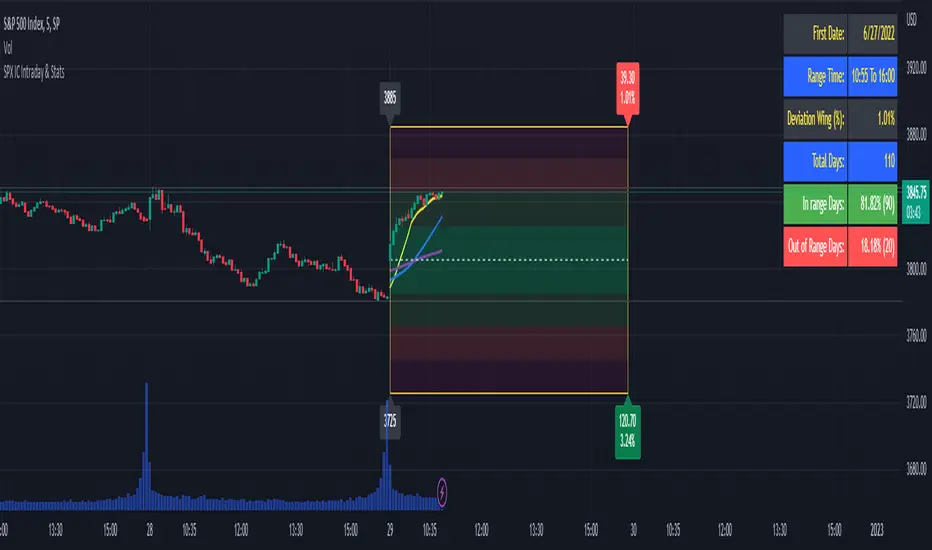
This indicator was designed for traders who make intraday Iron Condors with the SPX.
It basically has 2 main parts:
Part 1:
The indicator shows the distance, in real time, between the current SPX price and the IC selling wings (calls and puts wings) that have been selected. This result is displayed in percentages and in points. In the upper right corner (for calls) and lower right corner (for puts). The label will change color as the price moves closer to or further away from the sell strike. Darker red color as it approaches the wings, lighter green color as the price approaches the center of the Iron Condor.
Part 2:
Statistical dashboard showing the number of times in the past that from a certain hour (the current time) to the market close (4pm US East Time) the SPX moved outside or inside the width of the selected wings. The position of the table is configurable. By default, it's in the upper right corner.
Dashboard:
First Date: the first day of the sample (this varies depending on the timeframe, the higher the timeframe the larger the sample is, as TradingView counts more bars backwards, by default TV offers 10000 bars for the PRO version). Recommended 5 minutes.
Range Time: refers to the time range of the sample. From the current time to 4pm (US East Time).
Deviation Wing (%): It's the deviation (in percentage) based on the current time, from the current SPX price to the wing strikes. It takes the smaller value, either call or put wing.
Total Days: the number of days in the sample.
In range Days: the number of days that the price remained in that range from the current time to the market close.
Out of Range Days: the number of days the price ended outside that range from the current time to the market close.
Configuration:
Open Time (Hour): IC opening hour.
Open time (Minute): IC opening minutes.
Width Wings: width of the wings from the SPX price at the configured time.
Mini Rectangles: Refers to include within the IC 4 deviations (mini rectangles) to better visualize where the SPX price is with reference to the wings. Darker red color as it gets closer to the wings, lighter green color as the price gets closer to the center of the Iron Condor.
Add SMAs: Add SMAs 8, 20 and 50 to the IC chart.
Include Fundamental Days: Include or not in the sample important news days. They are considered: FED Meetings, CPI Reports, Unemployment Reports, Powell Speech.
Include Days: (Monday, Tuesday, Wednesday, Thursday, Friday). Include (or not) in the sample the chosen days.
Apply Filters Since: Sampling start date. Per default: False.
Table Position: Dashboard position.
Note 1: It's recommended to use the Dark Theme Color of TradingView.
Note 2: this indicator will only work in intraday timeframes less than 30 minutes (1m, 2m, 5m, 10m, 15m, 30m) and will only show results while the market is open.
************************************
Spanish Version:
Este indicador fue diseñado para los traders que hacen intradías de Iron Condors con el SPX.
Básicamente cuenta con 2 partes principales:
Parte 1:
El indicador muestra la distancia, en tiempo real, entre el actual precio del SPX y las alas vendedoras (alas calls y puts) que se hayan seleccionado. Este resultado se muestra en porcentajes y en puntos. En la esquina superior derecha (para los calls) e inferior derecha (para los puts). El label cambiará de color a medida que el precio se acerque o aleje del precio de las alas. Color rojo más oscuro a medida que se acerque a las alas, color verde claro cuando el precio se acerque al centro del Iron Condor.
Parte 2:
Dashboard estadístico que muestra la cantidad de veces que desde una determinada hora (el tiempo actual) hasta el cierre del mercado (4pm US East Time) el SPX se movió fuera o dentro del ancho de las alas seleccionadas. La posición de la tabla es configurable. Por defecto esta en la esquina superior derecha.
Dashboard:
First Date: el primer día de la muestra (esto varía dependiendo el timeframe, a mayor timeframe la muestra es mayor, ya que TradingView contará más barras para atrás (por default TV ofrece 10000 barras para la versión PRO). Recomendado 5 minutos.
Range Time: se refiere al rango horario de la muestra. Desde la hora actual hasta las 4pm (US East Time)
Deviation Wing (%): Es la desviación en porcentaje en base a la hora actual, desde el precio actual del SPX hasta el ancho de las alas. Toma el menor valor, sea al ala call o al ala put.
Total Days: la cantidad de días de la muestra.
In range Days: la cantidad de días que el precio se mantuvo en ese rango desde la hora actual hasta el cierre del mercado
Out of Range Days: la cantidad de días que el precio terminó fuera de ese rango desde la hora actual hasta el cierre del mercado.
Configuración:
Open Time (Hour): Hora de apertura del IC.
Open time (Minute): Minutos de apertura del IC.
Width Wings: ancho de las alas desde el precio del SPX a la hora configurada.
MiniRectangles: Se refiere a incluir dentro del IC 4 desviaciones (mini rectángulos) para visualizar de mejor manera donde se encuentra el precio del SPX con referencia a las alas. Color rojo más oscuro a medida que se acerque a las alas, color verde claro cuando el precio se acerque al centro del Iron Condor.
Add SMAs: Agrega al cuadro las SMA 8, 20 y 50.
Include Fundamental Days: Incluye o no en la muestra días de noticias importantes. Son considerados: FED Meetings, CPI Reports, Unemployment Reports, Powell Speech.
Include Days: (Monday, Tuesday, Wednesday, Thursday, Friday). Incluye (o no) en la muestra los días elegidos.
Apply Filters Since: Fecha de comienzo del muestreo.
Table Position: Posición del dashboard.
Nota 1: se recomienda usar el Dark Theme Color de TradingView.
Nota 2: este indicador solo funcionará en temporalidades intradías menores a 30 minutos (1m,2m,5m,10m,15m,30m) y Solo mostrará resultados mientras el mercado esté abierto, o sea en tiempo real.
Script protetto
Questo script è pubblicato come codice protetto. Tuttavia, è possibile utilizzarlo liberamente e senza alcuna limitazione – per saperne di più clicca qui.
Declinazione di responsabilità
Le informazioni ed i contenuti pubblicati non costituiscono in alcun modo una sollecitazione ad investire o ad operare nei mercati finanziari. Non sono inoltre fornite o supportate da TradingView. Maggiori dettagli nelle Condizioni d'uso.