OPEN-SOURCE SCRIPT
Aggiornato Half Candle Retrace
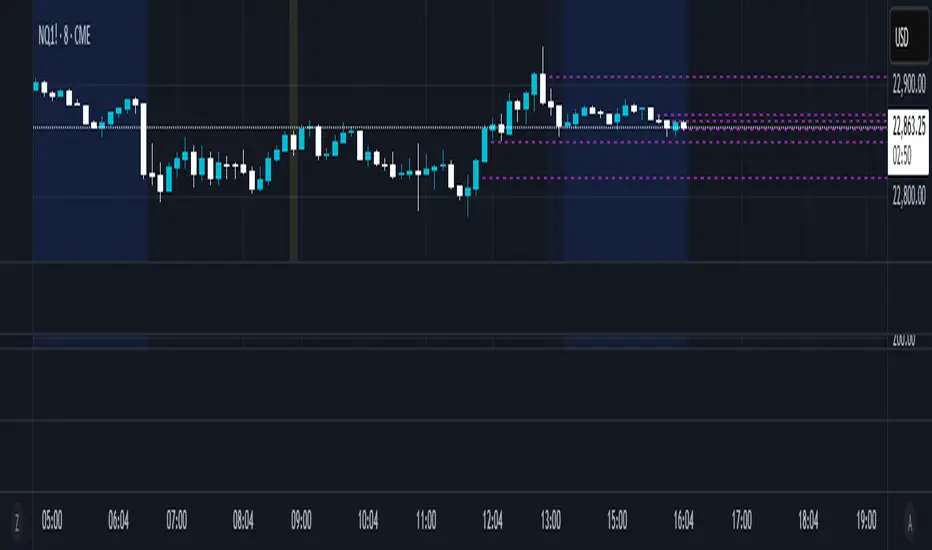
This custom indicator draws a horizontal line at the 50% retracement level of each candlestick on the chart. It calculates the midpoint between the high and low of each candle, which is often used by traders to identify potential entry, exit and take-profit levels. Once price action returns to an untouched level, the line will be removed, leaving only the levels where price action is still missing.
Key Features:
Timeframe: Works on all timeframes.
Line Color: Customize the line color to suit your charting preferences.
Line Width: Adjust the thickness of the retracement line for better visibility.
Line Style: Choose between solid, dotted, or dashed lines.
Up/Down Candle Selection: Option to only display retracement lines for up (bullish) candles, down (bearish) candles, or both.
Full Customization: Control the transparency (opacity) of the line for enhanced visual clarity.
Simple Setup: No complicated settings – simply choose your preferred color, line style, and visibility options.
This indicator is perfect for traders who prefer to use price action and retracement levels to identify potential trade opportunities.
How It Works:
The indicator automatically calculates the 50% level (midpoint) for each candlestick, drawing a line at this level. It will only draw lines for candles that match your chosen criteria (up or down candles), ensuring the chart remains clean and relevant to your trading strategy. Lines are automatically removed as soon as price crosses them.
Note di rilascio
v2.0 - Added user input for showing current day onlyScript open-source
Nello spirito di TradingView, l'autore di questo script lo ha reso open source, in modo che i trader possano esaminarne e verificarne la funzionalità. Complimenti all'autore! Sebbene sia possibile utilizzarlo gratuitamente, ricordiamo che la ripubblicazione del codice è soggetta al nostro Regolamento.
Declinazione di responsabilità
Le informazioni e le pubblicazioni non sono intese come, e non costituiscono, consulenza o raccomandazioni finanziarie, di investimento, di trading o di altro tipo fornite o approvate da TradingView. Per ulteriori informazioni, consultare i Termini di utilizzo.
Script open-source
Nello spirito di TradingView, l'autore di questo script lo ha reso open source, in modo che i trader possano esaminarne e verificarne la funzionalità. Complimenti all'autore! Sebbene sia possibile utilizzarlo gratuitamente, ricordiamo che la ripubblicazione del codice è soggetta al nostro Regolamento.
Declinazione di responsabilità
Le informazioni e le pubblicazioni non sono intese come, e non costituiscono, consulenza o raccomandazioni finanziarie, di investimento, di trading o di altro tipo fornite o approvate da TradingView. Per ulteriori informazioni, consultare i Termini di utilizzo.