SuperTrend V — Volume Shadow趋势速度分析(中文)
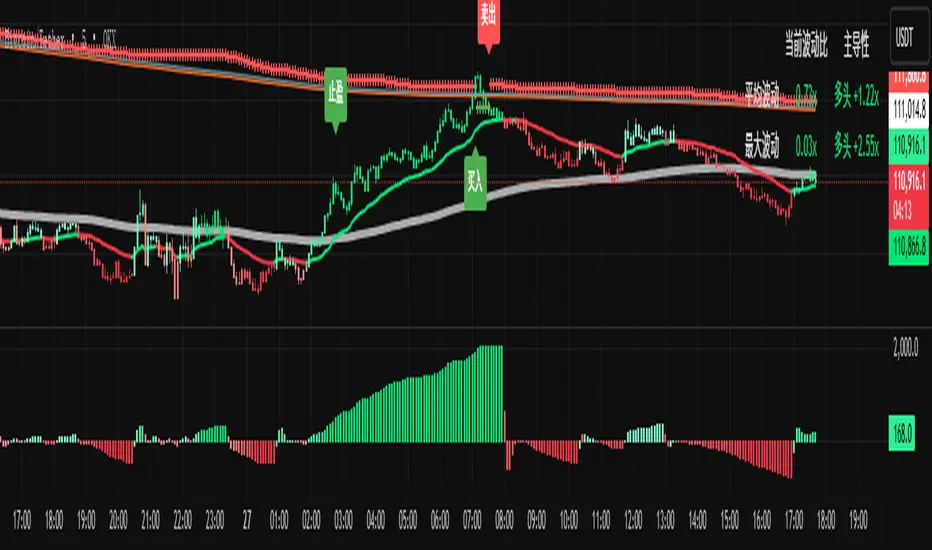
SuperTrend V — Volume Shadow augments the classic SuperTrend with a price–volume “Volume Shadow” core and an EMA-smoothed centerline. Trend direction is derived from ATR bands around that center. The tool also adds a higher-timeframe EMA band (red/blue) for regime filtering and a linear-regression ±σ channel for take-profit triggers—giving you a simple “enter → trail → take profit” workflow.
How it works
Volume Shadow center: a volatility-scaled, volume-diffused series (out) built from price spread and volume; smoothed with EMA to form the SuperTrend base.
SuperTrend line: ATR bands around the smoothed center; green/red cross plot shows the active trailing level.
HTF reference band: red = EMA of out, blue = EMA of open, both computed from a reference timeframe (default 720 minutes). Red above blue = bullish regime; red below blue = bearish regime.
±σ take-profit channel: rolling linear regression midline ± (σ × stdev). Crosses of these bands emit TP triggers.
Inputs
Reference Timeframe (minutes) — default 720.
SuperTrend Multiplier (st_mult) — default 1.0 (higher = fewer, sturdier signals).
SuperTrend Period (st_period) — default 10 (ATR length).
TP Multiplier (σ) — default 2.
TP Window Length (len5) — default 150.
Signals & alerts
Buy: close crosses above the SuperTrend line and price is above the blue EMA.
Sell: close crosses below the SuperTrend line and price is below the blue EMA.
TP triggers (±σ channel)
Long TP Trigger: price crosses down through the upper band (crossunder upper).
Short TP Trigger: price crosses up through the lower band (crossover lower).
Recommended usage (workflow)
Regime filter
Trade longs only when red EMA > blue EMA; shorts only when red EMA < blue EMA.
Entries
Go long on Buy; go short on Sell (both require agreement with the regime filter).
Risk & exit
Use the SuperTrend line as a dynamic stop; flip/exit on an opposite cross.
Take profit
When a TP trigger fires (±σ channel), scale out or trail stops to the most recent ST level.
Suggested starting points
High-volatility (crypto, indices): st_mult 1.2–1.6, st_period 10–14, σ 2–2.5.
Lower-volatility (FX): st_mult 0.8–1.2, st_period 10, σ 1.5–2.
Script su invito
Solo gli utenti approvati dall'autore possono accedere a questo script. È necessario richiedere e ottenere l'autorizzazione per utilizzarlo. Tale autorizzazione viene solitamente concessa dopo il pagamento. Per ulteriori dettagli, seguire le istruzioni dell'autore riportate di seguito o contattare direttamente nxwctkjf.
TradingView NON consiglia di pagare o utilizzare uno script a meno che non ci si fidi pienamente del suo autore e non si comprenda il suo funzionamento. Puoi anche trovare alternative gratuite e open-source nei nostri script della comunità.
Istruzioni dell'autore
Attenzione: prima di richiedere l'accesso, leggi la nostra guida per gli script su invito.
Declinazione di responsabilità
Script su invito
Solo gli utenti approvati dall'autore possono accedere a questo script. È necessario richiedere e ottenere l'autorizzazione per utilizzarlo. Tale autorizzazione viene solitamente concessa dopo il pagamento. Per ulteriori dettagli, seguire le istruzioni dell'autore riportate di seguito o contattare direttamente nxwctkjf.
TradingView NON consiglia di pagare o utilizzare uno script a meno che non ci si fidi pienamente del suo autore e non si comprenda il suo funzionamento. Puoi anche trovare alternative gratuite e open-source nei nostri script della comunità.
Istruzioni dell'autore
Attenzione: prima di richiedere l'accesso, leggi la nostra guida per gli script su invito.