OPEN-SOURCE SCRIPT
BB phases
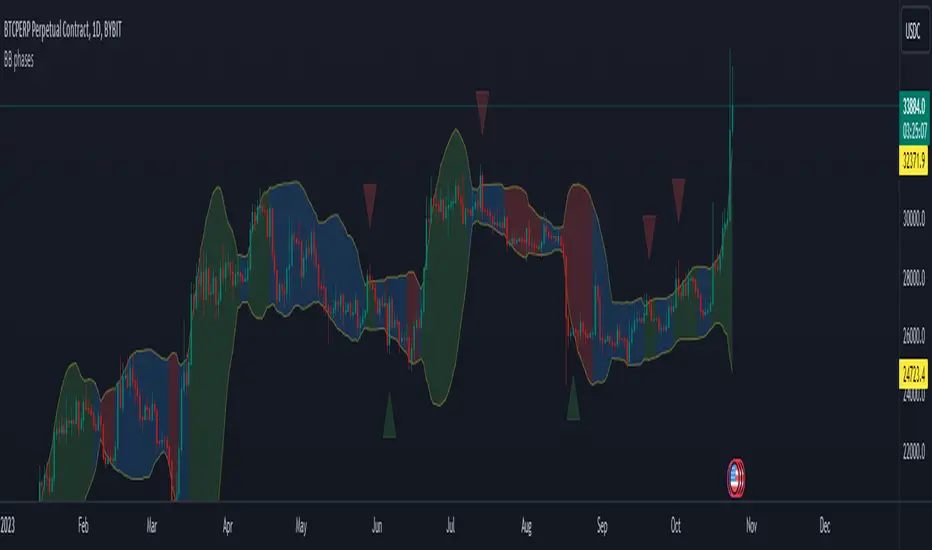
This indicator is designed to visually represent different market phases based on Bollinger Bands (BB) and provide insights into potential bullish and bearish signals. Let's break down what the indicator does:
The indicator smoothly transitions from the "squeeze" phase to "bullish" or "bearish" phases based on specific price conditions. Here's a more detailed explanation of how this transition occurs:
Another feature of the indicator is to display bearish/bullish triangles when the price reintegrate the bollinger bands after it previously breaked it. For example if the price closes below the lower BB and then the next candle in above the lower BB, a bullish triangle will be displayed.
The indicator smoothly transitions from the "squeeze" phase to "bullish" or "bearish" phases based on specific price conditions. Here's a more detailed explanation of how this transition occurs:
- Squeeze Phase: The "squeeze" phase is identified when the closing price is within the range between the upper Bollinger Band (upper BB) and the lower Bollinger Band (lower BB).
- Transition to Bullish Phase: The transition from "squeeze" to "bullish" phase occurs when the price closes above the upper BB. The bullish phase will last while the price hasn't closed below the middle BB.
- Transition to Bearish Phase: Conversely, the transition from "squeeze" to "bearish" phase occurs when the price closes below the lower BB. The bearish phase will last while the price hasn't closed above the middle BB.
Another feature of the indicator is to display bearish/bullish triangles when the price reintegrate the bollinger bands after it previously breaked it. For example if the price closes below the lower BB and then the next candle in above the lower BB, a bullish triangle will be displayed.
Script open-source
In pieno spirito TradingView, il creatore di questo script lo ha reso open-source, in modo che i trader possano esaminarlo e verificarne la funzionalità. Complimenti all'autore! Sebbene sia possibile utilizzarlo gratuitamente, ricorda che la ripubblicazione del codice è soggetta al nostro Regolamento.
Declinazione di responsabilità
Le informazioni ed i contenuti pubblicati non costituiscono in alcun modo una sollecitazione ad investire o ad operare nei mercati finanziari. Non sono inoltre fornite o supportate da TradingView. Maggiori dettagli nelle Condizioni d'uso.