PROTECTED SOURCE SCRIPT
Major S&R Levels with Flips
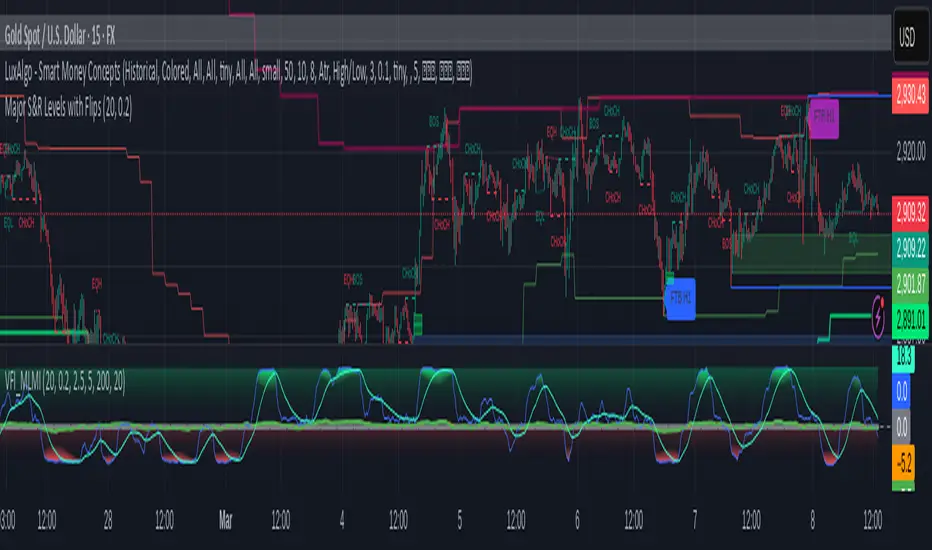
## **Major S&R Levels with Flips**
This script is designed to identify and visualize **Major Support and Resistance (S&R) Levels** across multiple timeframes (H1, H4, D1) and detect **S&R Flip** patterns (FTB, STB, FTR). It also includes customizable alerts for price-level crossings, flip patterns, and level approaches. Below is a detailed breakdown of the script's functionality, inputs, and outputs.
---
## **Script Overview**
The script calculates and plots **Support and Resistance (S&R) Levels** based on the highest highs and lowest lows over a user-defined lookback period. It also detects **S&R Flip Patterns** (First Time Back - FTB, Second Time Back - STB, Failed Test of Resistance/Support - FTR) and provides alerts for key events.
---
## **Key Features**
1. **Multi-Timeframe S&R Levels**:
- Displays S&R levels for **H1**, **H4**, and **D1** timeframes.
- Levels are calculated using the highest highs and lowest lows over a user-defined lookback period.
2. **S&R Flip Detection**:
- Detects and tracks **FTB (First Time Back)**, **STB (Second Time Back)**, and **FTR (Failed Test of Resistance/Support)** patterns.
- Alerts are generated for each flip event.
3. **Customizable Alerts**:
- **Price-Level Crossing Alerts**: Notifies when the price crosses above or below a level.
- **Flip Alerts**: Notifies when a flip pattern (FTB, STB, FTR) is detected.
- **Level Approach Alerts**: Notifies when the price approaches a level within a user-defined threshold.
4. **Efficient Level Updates**:
- Levels are updated periodically (every 10 bars by default) to optimize performance.
5. **Visualization**:
- Plots S&R levels on the chart with distinct colors for each timeframe.
- Displays labels for recent flip events.
---
## **User Inputs**
The script provides several customizable inputs:
### **Level Display**
- **Show H1 Levels**: Toggles visibility of H1 S&R levels.
- **Show H4 Levels**: Toggles visibility of H4 S&R levels.
- **Show D1 Levels**: Toggles visibility of D1 S&R levels.
- **Lookback Period**: Defines the number of bars used to calculate S&R levels (default: 20, range: 5–50).
### **Alerts**
- **Enable Price-Level Crossing Alerts**: Toggles alerts for price crossing above/below S&R levels.
- **Enable SR Flip Alerts**: Toggles alerts for S&R flip patterns (FTB, STB, FTR).
- **Enable Level Approach Alerts**: Toggles alerts for price approaching S&R levels.
- **Approach Threshold**: Defines the percentage threshold for level approach alerts (default: 0.2%, range: 0.05%–1%).
---
## **Script Logic**
### **1. Level Calculation**
- The script calculates S&R levels for each timeframe (H1, H4, D1) using the highest highs and lowest lows over the lookback period.
- Levels are updated periodically (every 10 bars by default) to optimize performance.
### **2. Flip Detection**
- The script detects **FTB**, **STB**, and **FTR** patterns:
- **FTB (First Time Back)**: Price crosses a level for the first time.
- **STB (Second Time Back)**: Price retests the level after FTB.
- **FTR (Failed Test of Resistance/Support)**: Price fails to break the level after STB.
- Flip events are tracked and stored in arrays for visualization and alerts.
### **3. Alerts**
- **Price-Level Crossing Alerts**: Triggered when the price crosses above/below a level.
- **Flip Alerts**: Triggered when a flip pattern (FTB, STB, FTR) is detected.
- **Level Approach Alerts**: Triggered when the price approaches a level within the defined threshold.
### **4. Visualization**
- S&R levels are plotted on the chart with distinct colors for each timeframe.
- Labels are displayed for recent flip events (up to 15 labels by default).
---
## **Outputs**
### **1. Plots**
- **H1 Levels**:
- Support: Green shaded area.
- Resistance: Red shaded area.
- **H4 Levels**:
- Support: Lime shaded area.
- Resistance: Maroon shaded area.
- **D1 Levels**:
- Support: Teal shaded area.
- Resistance: Purple shaded area.
### **2. Labels**
- Labels are displayed for recent flip events:
- **FTB**: Blue label.
- **STB**: Yellow label.
- **FTR**: Purple label.
### **3. Alerts**
- Alerts are generated for:
- Price-level crossings.
- Flip patterns (FTB, STB, FTR).
- Price approaching levels.
---
## **Usage Instructions**
1. **Add the Script**:
- Copy and paste the script into a new Pine Script editor in TradingView.
- Save and add the script to your chart.
2. **Customize Inputs**:
- Adjust the inputs (e.g., lookback period, alert settings) in the script settings panel.
3. **Interpret the Output**:
- Use the plotted levels and labels to identify key S&R zones and flip patterns.
- Monitor alerts for trading opportunities.
4. **Optimize for Your Strategy**:
- Adjust the lookback period and alert thresholds to suit your trading style.
---
## **Example Use Cases**
1. **Trend Identification**:
- Use the D1 levels to identify major S&R zones for long-term trend analysis.
- Combine with H4 and H1 levels for intraday trading opportunities.
2. **Flip Patterns**:
- Look for FTB and STB patterns to identify potential reversals.
- Use FTR patterns to confirm failed breakouts.
3. **Alerts for Trading**:
- Set up alerts for price-level crossings and flip patterns to stay informed of key market movements.
---
## **Notes**
- The script is optimized for performance by updating levels periodically and limiting the number of tracked flips.
- Alerts are designed to minimize noise by triggering only once per bar or bar close.
---
## **Disclaimer**
This script is for educational and informational purposes only. It should not be considered financial advice. Always conduct your own analysis and backtesting before using any trading strategy.
---
This documentation provides a comprehensive guide to using the **Major S&R Levels with Flips** script. If you have any questions or need further assistance, feel free to reach out!
Script protetto
Questo script è pubblicato come codice protetto. Tuttavia, è possibile utilizzarle liberamente e senza alcuna limitazione – ulteriori informazioni qui.
Declinazione di responsabilità
Le informazioni e le pubblicazioni non sono intese come, e non costituiscono, consulenza o raccomandazioni finanziarie, di investimento, di trading o di altro tipo fornite o approvate da TradingView. Per ulteriori informazioni, consultare i Termini di utilizzo.