Normalized Volume IndexIn the realm of technical analysis, volume is more than just a measure of market activity—it’s a window into trader psychology. Two classic indicators that harness this insight are the Positive Volume Index (PVI) and Negative Volume Index (NVI). Developed in the early 20th century by Paul L. Dysart and later refined by Norman G. Fosback in 1976, these tools aim to distinguish between the behavior of the so-called “smart money” and the broader market crowd.
- Positive Volume Index (PVI) tracks price changes only on days when trading volume increases. It assumes that rising volume reflects the actions of less-informed retail traders—those who follow the herd.
- Negative Volume Index (NVI), on the other hand, focuses on days when volume decreases, under the premise that institutional investors (the “smart money”) are more active when the market is quiet.
This dichotomy allows traders to interpret market sentiment through the lens of volume behavior. For example, a rising NVI during a price uptrend may suggest that institutional investors are quietly accumulating positions—often a bullish signal.
Traders use PVI and NVI to:
- Confirm trends: If NVI is above its moving average, it often signals a strong underlying trend supported by smart money.
- Spot reversals: Divergences between price and either index can hint at weakening momentum or upcoming reversals.
- Gauge participation: PVI rising faster than price may indicate overenthusiastic retail buying—potentially a contrarian signal.
These indicators are often paired with moving averages (e.g., 255-day EMA) to generate actionable signals. Fosback’s research suggested that when NVI is above its one-year EMA, there’s a high probability of a bull market.
While PVI and NVI are cumulative indices, normalizing them—for example, by rebasing to 100 or converting to percentage changes—offers several benefits:
- Comparability: Normalized indices can be compared across different assets or timeframes.
- Clarity: It becomes easier to visualize relative strength or weakness.
- Backtesting: Normalized values are more suitable for algorithmic strategies and statistical analysis.
Normalization also helps when combining PVI/NVI with other indicators in multi-factor models, ensuring no single metric dominates due to scale differences
In essence, PVI and NVI offer a nuanced view of market dynamics by separating the noise of volume surges from the quiet confidence of institutional moves. When normalized and interpreted correctly, they become powerful allies in a trader’s decision-making toolkit.
How to use this (Educational material):
For instance, on average, when the Negative Volume Index (NVI) remains above its midline, the market tends to trend positively, reflecting consistent institutional participation. However, when the NVI dips and stays below the midline, it often signals a negative trend, indicating that smart money is stepping away or reducing exposure.
Another telling scenario occurs when the Positive Volume Index (PVI) drops below the NVI. While this might coincide with a brief price dip, institutions often interpret this as an opportunity to buy the dip, quietly accumulating positions while retail participants exit in panic. The result? A market recovery driven by smart money.
Conversely, when the PVI consistently remains above the NVI, it may point to retail enthusiasm outpacing institutional support. This imbalance can flag a tired or overextended trend, where the smart money has already positioned itself defensively. When this pattern persists, there's a high likelihood that institutions will pull the plug, leading to a pronounced trend reversal.
Multitimeframe

Custom EMA High/Low & SMA - [GSK-VIZAG-AP-INDIA] Custom EMA High/Low & SMA -
1. Overview
This indicator overlays a dynamic combination of Exponential Moving Averages (EMA) and Simple Moving Average (SMA) to identify momentum shifts and potential entry/exit zones. It highlights bullish or bearish conditions using color-coded SMA logic and provides visual Buy/Sell signals based on smart crossover and state-based logic.
2. Purpose / Use Case
Designed for traders who want to visually identify momentum breakouts, trend reversals, or pullback opportunities, this tool helps:
Spot high-probability buy/sell zones
Confirm price strength relative to volatility bands (EMA High/Low)
Time entries based on clean visual cues
It works well in trend-following strategies, particularly in intraday or swing setups across any liquid market (indices, stocks, crypto, etc.).
3. Key Features & Logic
✅ EMA High/Low Channel: Acts as dynamic support/resistance boundaries using 20-period EMAs on high and low prices.
✅ Timeframe-Specific SMA: A 33-period SMA calculated from a user-defined timeframe (default: 10-minute) for flexible multi-timeframe analysis.
✅ Signal Generation:
Buy: When SMA drops below EMA Low and close is above EMA High.
Sell: When SMA rises above EMA High and price closes below both EMAs.
Optionally, signals also fire based on SMA color changes (green = bullish, red = bearish).
✅ Strict or Loose Signal Logic: Choose between precise crossovers or broader state-based conditions.
✅ Debugging Tools: Optional markers for granular insight into condition logic.
4. User Inputs & Settings
Input Description
EMA High Length Period for EMA of high prices (default: 20)
EMA Low Length Period for EMA of low prices (default: 20)
SMA Length Period for Simple Moving Average (default: 33)
SMA Timeframe Timeframe for SMA (default: “10”)
Show Buy/Sell Arrows Enable visual arrow signals for Buy/Sell
Strict Signal Logic ON = crossover-based signals; OFF = state logic
Plot Signals on SMA Color Change Enable signals on SMA color shifts (Green/Red)
Show Debug Markers Plot small markers to debug condition logic
5. Visual Elements Explained
🔵 EMA High Line – Blue line marking dynamic resistance
🔴 EMA Low Line – Red line marking dynamic support
🟡 SMA Line – Color-coded based on position:
Green if SMA < EMA Low (Bullish)
Red if SMA > EMA High (Bearish)
Yellow otherwise (Neutral)
✅ BUY / SELL Labels – Displayed below or above candles on valid signals
🛠️ Debug Circles/Triangles – Help visually understand the signal logic when enabled
6. Usage Tips
Best used on 5–30 min timeframes for intraday setups or 1H+ for swing trades.
Confirm signals with volume, price action, or other confluences (like support/resistance).
Use strict mode for more accurate entries, and non-strict mode for broader trend views.
Ideal for identifying pullbacks into trend, or early reversals after volatility squeezes.
7. What Makes It Unique
Multi-timeframe SMA integrated with EMA High/Low bands
Dual signal logic (crossover + color shift)
Visually intuitive and beginner-friendly
Minimal clutter with dynamic signal labeling
Debug mode for transparency and learning
8. Alerts & Automation
The indicator includes built-in alert conditions for:
📈 Buy Alert: Triggered when a bullish condition is detected.
🔻 Sell Alert: Triggered when bearish confirmation is detected.
These alerts can be used with TradingView's alert system for real-time notifications or bot integrations.
9. Technical Concepts Used
EMA (Exponential Moving Average): Reacts faster to recent price, ideal for trend channels
SMA (Simple Moving Average): Smoother average for detecting general trend direction
Crossover Logic: Checks when SMA crosses over or under EMA levels
Color Coding: Visual signal enhancement based on relative positioning
Multi-Timeframe Analysis: SMA calculated on a custom timeframe, powerful for confirmation
10. Disclaimer
This script is for educational and informational purposes only. It is not financial advice. Always backtest thoroughly and validate on demo accounts before applying to live markets. Trading involves risk, and past performance does not guarantee future results.
11. Author Signature
📌 Indicator Name: Custom EMA High/Low & SMA -
👤 Author: GSK-VIZAG-AP-INDIA

Avg daily rangeThe Average Daily Range (ADR) is a technical indicator that measures the average price movement of a financial instrument over a specific period.

F&O Time Zones – Final Fixed📌 This indicator highlights high-probability intraday time zones used in Indian F&O (Futures & Options) strategies. Ideal for scalping, breakout setups, and trap avoidance.
🕒 Covered Time Zones:
• 9:15 – 9:21 AM → Flash Trades (first 1-minute volatility)
• 9:21 – 9:30 AM → Smart Money Trap (VWAP fakeouts)
• 9:30 – 9:50 AM → Fake Breakout Zone
• 9:50 – 10:15 AM → Institutional Entry Timing
• 10:15 – 10:45 AM → VWAP Range Scalps
• 10:45 – 11:15 AM → Second Trap Zone
• 11:15 – 1:00 PM → Trend Continuation Window
• 1:00 – 1:45 PM → Volatility Compression
• 1:45 – 2:15 PM → Institutional Exit Phase 1
• 2:15 – 2:45 PM → Trend Acceleration / Reversals
• 2:45 – 3:15 PM → Expiry Scalping Zone
• 3:15 – 3:30 PM → Dead Zone (square-off time)
🔧 Features:
✓ Clean vertical lines per zone
✓ Optional label positions (top or bottom)
✓ Adjustable line style, width, and color
🧠 Best used on: NIFTY, BANKNIFTY, FINNIFTY (5-min or lower)
---
🔒 **Disclaimer**:
This script is for **educational purposes only**. It is not financial advice. Trading involves risk. Please consult a professional or do your own research before taking any positions.
—
👤 Script by: **JoanJagan**
🛠️ Built in Pine Script v5

Multi-TF Candle Close - PROPTRADERZ Draws a horizontal ray at the close of the last completed candle from a selectable timeframe (e.g. 1m, 5m, 15m), regardless of your current chart. Includes optional price label with offset for better visibility on short-term charts like 15s or 5s. Great for multi-timeframe traders.

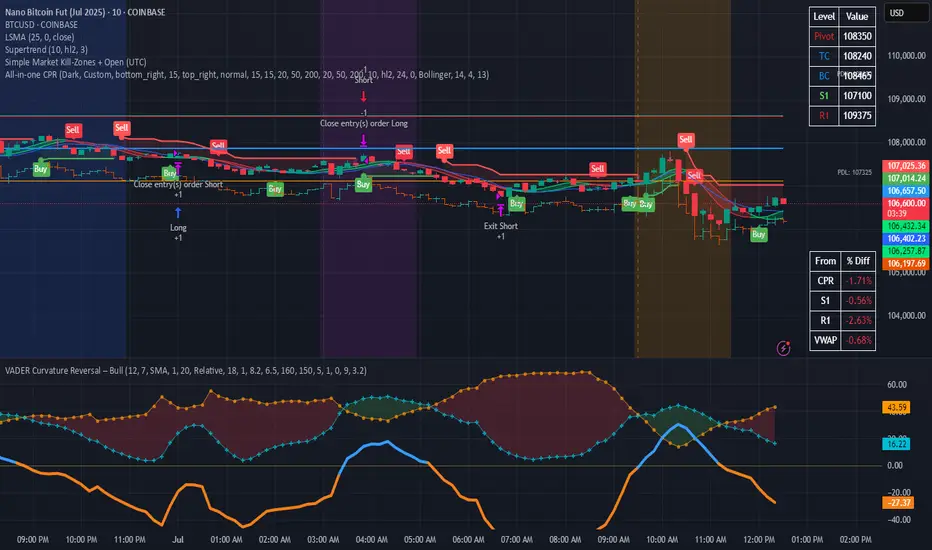
Simple Market Kill-Zones + Open (UTC)What it does
This Pine v6 indicator highlights the “kill-zones” around the big session opens—Asian (23:00–03:00 UTC), London (07:00–09:00 UTC) and New York (13:30–15:30 UTC)—by reading each bar’s actual UTC timestamp. It also draws dashed vertical lines at exactly 23:00, 07:00 and 13:30 UTC, so you never miss the liquidity ramps. Because it uses raw UTC hours/minutes, it stays accurate even when exchanges pause (e.g. Nano-BTC’s daily halt) or your chart’s display timezone changes.
Key Inputs
Show Asia/London/NY Kill Zone – toggle each shaded band on/off
Zone Colors – pick your own semi-transparent hues
Show Session-Open Lines – enable dashed verticals at the exact open times
Line Colors – customize the line opacity and style
How to use
Apply on your favorite timeframe (15 min–1 h is a sweet spot).
Toggle the zones you care about and pick readable colors.
Use the dashed lines as entry triggers or as visual bookmarks.
In your own Pine strategies, wrap order logic with the zone booleans to only trade when liquidity’s alive.
New MA Cross Strategy V6 By BRC Different MA added with resolution to improve performance using higher time frame

Crossing AveragesWe averages are crossing, volume increases. This script aims to plot the price relative to the averages that are crossing. If price markers are below the average lines, that usually indicates weakness.

✅ SMA20 Trend Table -(MAJOAK)Trend table of Bullish or Bearish to the SMA 20. Displays 1 Day, 1Hr, 15 Min and 5 min.


Order Blocks v2Order Blocks v2 – Smart OB Detection with Time & FVG Filters
Order Blocks v2 is an advanced tool designed to identify potential institutional footprints in the market by dynamically plotting bullish and bearish order blocks.
This indicator refines classic OB logic by combining:
Fractal-based break conditions
Time-level filtering (Power of 3)
Optional Fair Value Gap (FVG) confirmation
Real-time plotting and auto-invalidation
Perfect for traders using ICT, Smart Money, or algorithmic timing models like Hopplipka.
🧠 What the indicator does
Detects order blocks after break of bullish/bearish fractals
Supports 3-bar or 5-bar fractal structures
Allows OB detection based on close breaks or high/low breaks
Optionally confirms OBs only if followed by a Fair Value Gap within N candles
Filters OBs based on specific time levels (3, 7, 11, 14) — core anchors in many algorithmic models
Automatically deletes invalidated OBs once price closes through the zone
⚙️ How it works
The indicator:
Tracks local fractal highs/lows
Once a fractal is broken by price, it backtracks to identify the best OB candle (highest bullish or lowest bearish)
Validates the level by checking:
OB type logic (close or HL break)
Time stamp match with algorithmic time anchors (e.g. 3, 7, 11, 14 – known from the Power of 3 concept)
Optional FVG confirmation after OB
Plots OB zones as lines (body or wick-based) and removes them if invalidated by a candle close
This ensures traders see only valid, active levels — removing noise from broken or out-of-context zones.
🔧 Customization
Choose 3-bar or 5-bar fractals
OB detection type: close break or HL break
Enable/disable OBs only on times 3, 7, 11, 14 (Hopplipka style)
Optional: require nearby FVG for validation
Line style: solid, dashed, or dotted
Adjust OB length, width, color, and use body or wick for OB height
🚀 How to use it
Add the script to your chart
Choose your preferred OB detection mode and filters
Use plotted OB zones to:
Anticipate price rejections and reversals
Validate Smart Money or ICT-based entry zones
Align setups with algorithmic time sequences (3, 7, 11, 14)
Filter out invalid OBs automatically, keeping your chart clean
The tool is useful on any timeframe but performs best when combined with a liquidity-based or time-anchored trading model.
💡 What makes it original
Combines fractal logic with OB confirmation and time anchors
Implements time-based filtering inspired by Hopplipka’s interpretation of the "Power of 3"
Allows OB validation via optional FVG follow-up — rarely available in public indicators
Auto-cleans invalidated OBs to reduce clutter
Designed to reflect market structure logic used by institutions and algorithms
💬 Why it’s worth using
Order Blocks v2 simplifies one of the most nuanced parts of SMC: identifying clean and high-probability OBs.
It removes subjectivity, adds clear timing logic, and integrates optional confluence tools — like FVG.
For traders serious about algorithmic-level structure and clean setups, this tool delivers both logic and clarity.
⚠️ Important
This indicator:
Is not a signal generator or financial advice tool
Is intended for experienced traders using OB/SMC/time-based logic
Does not predict market direction — it provides visual structural levels only

Base Finder ProFind bases easily with Base finder pro. For each bases, plots length and depth of the bases.

Candle Pattern Detector By Prashanth
Bullish Signal (🟢 below candle):
Plotted when any of the following occur:
✅ Bullish Engulfing
✅ Bullish Three-Line Strike
✅ Bottom wick ≥ % threshold (default: 80%)
Bearish Signal (🔴 above candle):
Plotted when any of the following occur:
❌ Bearish Engulfing
❌ Bearish Three-Line Strike
❌ Top wick ≥ % threshold (default: 80%)
Only one signal per candle (🟢 or 🔴)
If both bullish and bearish conditions happen on same candle → no signal
Helps simplify visual clutter while scanning for strong candle patterns

OTE+STDV MultiTF IndicatorVERY ROUGH DRAFT OF INDICATOR EXPECTS BUGS. I AM NOT A CODER SO THIS SHOULD NOT BE PERFECT.
Place limit orders on yellow lines. You will get a buy signal only during perfect A+ setups.
PLEASE MESSAGE ME IF YOU ARE A CODER AND CAN FIX THIS OR MAKE IT BETTER
Discord: itscwiby
Orange Lines are Rejection Zones
Yellow Lines are Limit order spots. Usually you want to take this with a 40 tick SL. You can also use a Fib tool on the green box to get a better entry.
Generally you want to look at the 30m chart or higher for these zones and find a optimal entry on a smaller timeframe.

Overnight High/Low, Session High/LowGives you the following information:
- Previous session(s) high and low (up to 10)
- The current session overnight high and low
- The previous session open and close
When any prior day high or low is broken, the line for it will stop extending to the right.

EMA Trend Dashboard
Trend Indicator using 3 custom EMA lines. Displays a table with 5 rows(position configurable)
-First line shows relative position of EMA lines to each other and outputs Bull, Weak Bull, Flat, Weak Bear, or Bear. EMA line1 should be less than EMA line2 and EMA line 2 should be less than EMA line3. Default is 9,21,50.
-Second through fourth line shows the slant of each EMA line. Up, Down, or Flat. Threshold for what is considered a slant is configurable. Also added a "steep" threshold configuration for steep slants.
-Fifth line shows exhaustion and is a simple, configurable calculation of the distance between EMA line1 and EMA line2.
--Lines one and five change depending on its value but ALL other colors are able to be changed.
--Default is somewhat set to work well with Micro E-mini Futures but this indicator can be changed to work on anything. I created it to help get a quick overview of short-term trend on futures. I used ChatGPT to help but I am still not sure if it actually took longer because of it.

Fisher Transform Background StripesThe "Fisher Transform Background Stripes" indicator is an easy-to-use tool that helps traders identify extreme market conditions using the Fisher Transform, a technical indicator that normalizes price data to highlight potential reversals. It displays colored background stripes on your chart to show when the market is oversold or undersold, making it simple to spot trading opportunities.
How It Works:Fisher Transform Calculation: The indicator calculates the Fisher Transform based on a user-defined period (default: 9), using the average of high and low prices to measure market momentum and identify extreme price movements.
Oversold/Undersold Levels: It highlights when the Fisher Transform is above a user-set oversold level (default: 3.0) with red background stripes, or below an undersold level (default: -2.0) with green background stripes.
Visual Feedback: Red and green stripes appear on the chart to mark oversold or undersold conditions, helping you quickly understand market extremes.
Customization: You can adjust the Fisher Transform period, oversold/undersold levels, background colors, and transparency. You can also enable an optional Fisher Transform plot or display values on the chart for debugging.
Wait for Close Option: You can choose whether the indicator waits for the timeframe’s candle to close before showing stripes, ensuring more reliable signals.
Alerts: Optional alerts notify you when the Fisher Transform crosses into oversold or undersold zones (always using confirmed values for accuracy).
Who It’s For: This indicator is ideal for beginner and intermediate traders looking for a clear, visual way to track extreme market conditions and potential reversals using the Fisher Transform.
Key Features:Colored background stripes for oversold (red) and undersold (green) conditions.
Customizable settings for period, levels, colors, and transparency.
Option to wait for candle close for more accurate signals.
Optional Fisher Transform plot and value display for analysis.
Alerts to notify you of key Fisher Transform level crossings.
This indicator provides a straightforward way to monitor market extremes and make informed trading decisions.

RSI OS/OB Background StripesThe "RSI OS/OB Background Stripes" indicator is a simple tool designed to help traders visualize overbought and oversold market conditions using the Relative Strength Index (RSI). It highlights these conditions by displaying colored background stripes directly on your chart, making it easy to spot potential trading opportunities.
How It Works:RSI Calculation: The indicator calculates the RSI, a popular momentum indicator that measures the speed and change of price movements, using a default period of 14 (customizable).
Overbought/Oversold Levels: It marks areas where the RSI is above a user-defined overbought level (default: 70) with red background stripes, and below an oversold level (default: 30) with green background stripes.
Visual Feedback: The colored stripes appear on the chart when the RSI enters overbought (red) or oversold (green) zones, helping you quickly identify market conditions.
Customization: You can adjust the RSI period, overbought/oversold levels, background colors, and transparency. You can also choose to show the RSI line in a separate panel or display RSI values on the chart for debugging.
Alerts: The indicator includes optional alerts that notify you when the RSI crosses into overbought or oversold territory.
Who It’s For: This indicator is perfect for beginner and intermediate traders who want a clear, visual way to track RSI-based overbought and oversold conditions without cluttering their charts.
Key Features:Easy-to-read background stripes for overbought (red) and oversold (green) conditions.
Fully customizable RSI settings, colors, and transparency.
Optional RSI plot and value display for deeper analysis.
Alerts to keep you informed of key RSI level crossings.
This indicator is a straightforward way to monitor market momentum and make informed trading decisions.

MTF Dashboard 9 Timeframes + Signals📊 MTF Dashboard — Multi-Timeframe Market Signal Matrix
Overview
The MTF Dashboard is an open-source Pine Script tool that enables traders to monitor key trend and momentum indicators across nine timeframes simultaneously—ranging from 1 minute to monthly—within a single unified view. This script is designed to support both discretionary and rules-based traders by improving efficiency in multi-timeframe analysis.
✅ Key Features
🔄 Multi-Timeframe Coverage
1m, 5m, 15m, 30m, 1H, 4H, 1D, 1W, 1M supported
Toggle individual timeframes on/off as per your trading style
📈 Built-in Technical Indicators
Trend Detection: Based on moving average (EMA) crossovers
Momentum Evaluation: Using Relative Strength Index (RSI)
MACD Status: Displays histogram trend
Volume Confirmation: Compares current volume to average
Confluence Rating: Optional logic combining indicator signals
🎨 Custom Dashboard Appearance
Supports light/dark chart modes
Adjustable panel positioning (Top/Bottom/Center Left/Right)
Multiple text size options
Color settings for bullish, bearish, and neutral signals
🔔 Optional Alerts
Alert conditions for confluence setups or trend changes (user must configure manually)
Use Cases
Identify trend alignment across short, medium, and long timeframes
Confirm entry or exit signals with high-confidence confluence
Detect early shifts in trend direction using EMA, RSI, MACD divergence
Quickly assess overall market sentiment in one glance
Limitations:
This script does not provide financial advice or guaranteed signals
Not intended for automatic trading or strategy backtesting
Users should interpret dashboard signals in the context of price structure and risk management
How to Use:
Add the script to your chart from your favorites
Open the settings panel:
Enable only the timeframes you want to analyze
Customize colors, position, and table layout
Optionally, right-click the script to configure alerts based on confluence or indicator changes
Technical Notes
EMA settings can be adjusted to match your trading system
Designed for visual clarity and performance with multiple timeframes enabled
Credits
This tool was developed to help the TradingView community simplify MTF analysis. Inspired by institutional-grade dashboards and adapted for manual charting use by retail traders.
Tags
#multi-timeframe #EMA #RSI #MACD #volume #confluence #dashboard #trend #momentum #open-source #pine-script #tradingview
License
Published as open-source under the TradingView community sharing model. Users are encouraged to modify, improve, and credit respectfully.

RSI Overbought ScannerRSI Overbought Scanner
Description
The RSI Overbought Scanner is a Pine Script indicator designed to identify potential overbought conditions across multiple timeframes (1-minute, 5-minute, and 15-minute) using the Relative Strength Index (RSI). This tool is ideal for traders looking to spot stocks or assets that may be overextended to the upside, potentially signaling a reversal or pullback opportunity.
Key Features
Multi-Timeframe Analysis: Evaluates RSI on 1m, 5m, and 15m timeframes to confirm overbought conditions (RSI > 70).
Visual Output: Plots a binary result (1 for overbought, 0 otherwise) for easy integration with TradingView's screener.
Debugging Table: Displays a table in the top-right corner showing RSI values and overbought status for each timeframe, with color-coded indicators (red for overbought, green for not overbought).
Alert Integration: Includes an alert condition that triggers when all three timeframes are overbought, providing a customizable message with the ticker symbol.
How It Works
RSI Calculation: Computes RSI with a default length of 14 for the 1m timeframe and retrieves RSI values for 5m and 15m timeframes using request.security.
Overbought Condition: Checks if RSI exceeds 70 on all three timeframes.
Output: Plots a value of 1 when all conditions are met, otherwise 0. A table updates on the last confirmed bar to show RSI values and overbought status.
Alerts: Triggers an alert when all timeframes are overbought, notifying users of potential trading opportunities.
Usage
Add the indicator to your chart and use it with TradingView's screener to filter assets meeting the overbought criteria.
Customize the RSI length or overbought level (default 70) in the indicator settings to suit your trading strategy.
Set up alerts to receive notifications when the overbought condition is met across all timeframes.
Notes
This script is written in Pine Script v6.
Best used in conjunction with other technical analysis tools to confirm signals.
The table is for debugging and visual confirmation, updating only on the last confirmed bar to avoid performance issues.

ORB NormanORB with adjustable times for up to 3 ORB's.
High and Low for each defined timeframe with adjustable lenghts for each day.

Pivot Projection Levels (Hi1, Hi2, Lo1, Lo2)Pivot Avg “Fair value” or equilibrium price
Hi1 1st upside projection — potential resistance
Hi2 Further extension — aggressive target
Lo1/Lo2 Same logic to the downside

Steez's Timeframe TableSimple timeframe indicator which can assist with daily bias or draw on liquidity.
Shows all timeframes from 1 minute to 1 day.
Shows close time and if the candle is currently bearish or bullish.
