OPEN-SOURCE SCRIPT
Window Periods
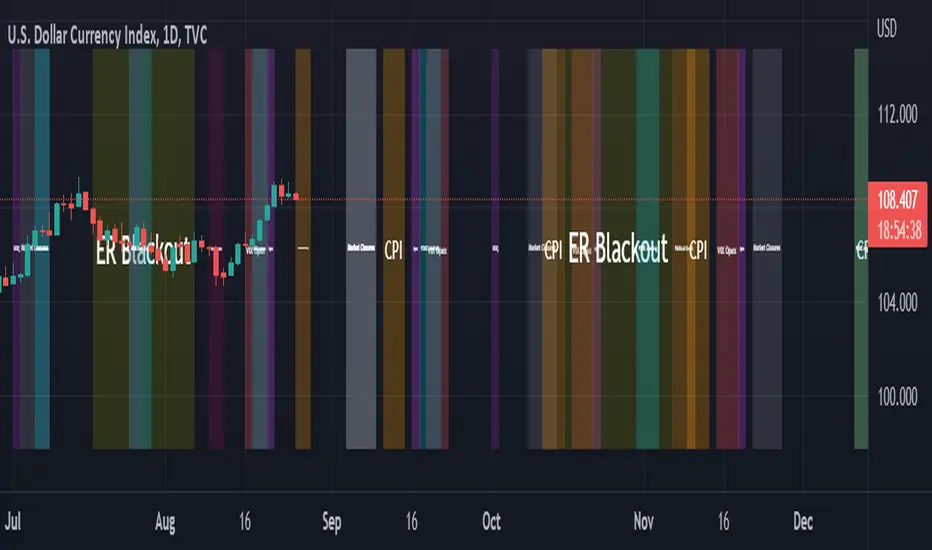
// Work in progress.. visualize event windows
// to do:
// - assign sector relevance (add opec events and weight more to commodity typed instruments, whereas revenue forecasts of walmart won't be as relevant to commodities)
// - create weighting onto macro probability valuators
// - create means to store window weight/values in an accessible way so that additional scripts can access this data (post hidden text in window?) or maybe just duplicate arrays elsewhere in additional code (terrible option)
// - correct colors to scale within like types of events (opex the same, rebalancing periods the same, political and financial meeting the same color etc..)
// - find a way to make transfer the timestamps or date strings as const variables usable within functions. v5 sends as series and cannot be converted back making this an overly complicated case instead of a function/library
// - add dates back to 2017 for better referencing
// - convert a number of the variables to inputs so they can be controlled in-chart, such as transparancy, and color of each window period?
Script open-source
Nello spirito di TradingView, l'autore di questo script lo ha reso open source, in modo che i trader possano esaminarne e verificarne la funzionalità. Complimenti all'autore! Sebbene sia possibile utilizzarlo gratuitamente, ricordiamo che la ripubblicazione del codice è soggetta al nostro Regolamento.
Tilden
Declinazione di responsabilità
Le informazioni e le pubblicazioni non sono intese come, e non costituiscono, consulenza o raccomandazioni finanziarie, di investimento, di trading o di altro tipo fornite o approvate da TradingView. Per ulteriori informazioni, consultare i Termini di utilizzo.