OPEN-SOURCE SCRIPT
Stock Comparison to S&P 500
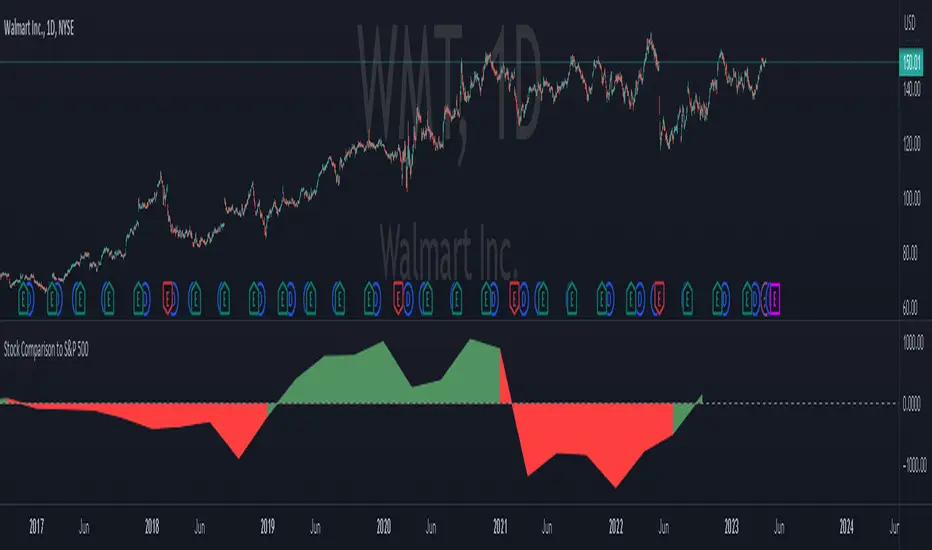
This indicator, "Stock Comparison to S&P 500," is designed to help traders compare the financial health and valuation of a chosen stock to the S&P 500 index. It compares several key financial metrics of the stock to the corresponding metrics of the S&P 500, including earnings growth, price-to-earnings ratio, price-to-book ratio, and price-to-sales ratio.
The indicator calculates the differences between each metric of the selected stock and the S&P 500, and then weights them using a formula that takes into account the importance of each metric. The resulting value represents the overall comparison between the stock and the S&P 500.
The indicator also displays the differences between the individual metrics in separate plots, allowing traders to see how each metric contributes to the overall comparison. Additionally, it colors the plots green if the selected stock is performing better than the S&P 500 in a particular metric and red if it's performing worse.
Traders can use this indicator to gain insight into the relative financial health and valuation of a selected stock compared to the S&P 500 index, which can help inform their trading decisions.
Script open-source
Nello spirito di TradingView, l'autore di questo script lo ha reso open source, in modo che i trader possano esaminarne e verificarne la funzionalità. Complimenti all'autore! Sebbene sia possibile utilizzarlo gratuitamente, ricordiamo che la ripubblicazione del codice è soggetta al nostro Regolamento.
Declinazione di responsabilità
Le informazioni e le pubblicazioni non sono intese come, e non costituiscono, consulenza o raccomandazioni finanziarie, di investimento, di trading o di altro tipo fornite o approvate da TradingView. Per ulteriori informazioni, consultare i Termini di utilizzo.