OPEN-SOURCE SCRIPT
Aggiornato Within Standard Deviation Bounds Probability

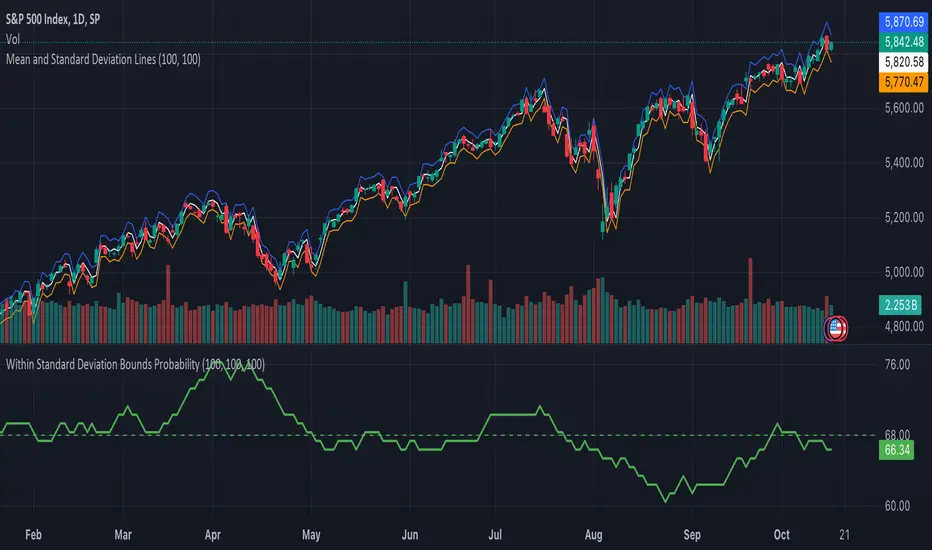
This indicator calculates the probability of the closing price remaining within the upper and lower bounds defined by the mean and standard deviation of historical percent changes. It also plots the probability line and a horizontal line at 68%, which would be the expected probability for a normal distribution. It is designed to be used with my other indicator "Mean and Standard Deviation Lines.
Inputs:
period (Days): This defines the number of bars used to calculate the mean and standard deviation.
Calculations:
Percent change: Calculates the daily percentage change between closing prices.
Mean and standard deviation: Calculates the mean and standard deviation of the percent changes over the specified period.
Bounds: Calculates the upper and lower bounds by adding/subtracting the standard deviation from the mean, multiplied by the closing price.
Crossover tracking: Iterates through bars and counts crosses above and below the bounds.
Probability calculation: Calculates the total crossover probability as a percentage of the period.
Plotting: Plots the probability line and the horizontal line at 68%.
Limitations:
Assumes a normal distribution of price changes, which may not be accurate in real markets.
Overall:
This indicator provides a way to visualize the probability of the price staying within calculated bounds based on historical volatility. However, it's important to be aware of its limitations and interpret the results within the context of your trading strategy and risk management.
Note di rilascio
added Probability of up/down crossings within the last period.Note di rilascio
Changed display order to match the Mean and Standard Devialtion Lines indicatorNote di rilascio
added probability of closing above the meanadded horizontal line at 50%
Note di rilascio
change some colors and added the probability to close below the current price as a red line.Note di rilascio
added horizontal lines at 5% and 95%Note di rilascio
updated the math. This indicator is a work in progress so be careful when you use it.Note di rilascio
added probability of the mean to occur with the bar range in purple and changed the default period to 100.Note di rilascio
copyright notice and cleanup.Note di rilascio
Cleaned things up to be consistent with the title of the script. The script calculates the probability the close will remain within the bounds shown in mean and standard deviation lines script within the specified period.Note di rilascio
Updated the script to use built-in functions to calculation sample statistics.Added separate variables to calculate sample mean and standard deviation.
Added a variable to control probability calculation window.
Note di rilascio
updated the license to Creative Commons BY-NC-ND 4.0Script open-source
Nello spirito di TradingView, l'autore di questo script lo ha reso open source, in modo che i trader possano esaminarne e verificarne la funzionalità. Complimenti all'autore! Sebbene sia possibile utilizzarlo gratuitamente, ricordiamo che la ripubblicazione del codice è soggetta al nostro Regolamento.
Declinazione di responsabilità
Le informazioni e le pubblicazioni non sono intese come, e non costituiscono, consulenza o raccomandazioni finanziarie, di investimento, di trading o di altro tipo fornite o approvate da TradingView. Per ulteriori informazioni, consultare i Termini di utilizzo.
Script open-source
Nello spirito di TradingView, l'autore di questo script lo ha reso open source, in modo che i trader possano esaminarne e verificarne la funzionalità. Complimenti all'autore! Sebbene sia possibile utilizzarlo gratuitamente, ricordiamo che la ripubblicazione del codice è soggetta al nostro Regolamento.
Declinazione di responsabilità
Le informazioni e le pubblicazioni non sono intese come, e non costituiscono, consulenza o raccomandazioni finanziarie, di investimento, di trading o di altro tipo fornite o approvate da TradingView. Per ulteriori informazioni, consultare i Termini di utilizzo.