Aggiornato
Nautilus Oscillator [BigBeluga]
NAUTILUS OSCILLATOR
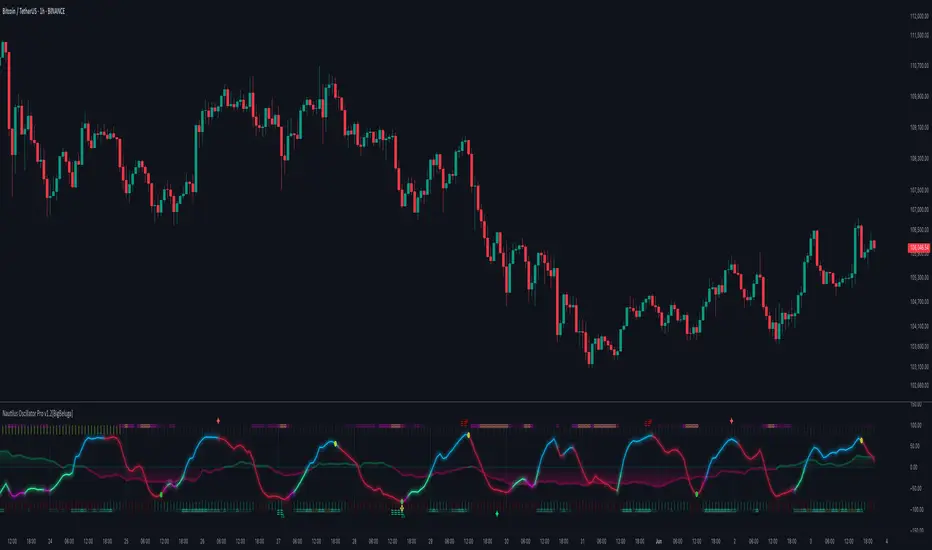
The Nautilus Oscillator by BigBeluga is an advanced technical analysis tool designed to help traders identify trend direction, strength, and potential reversal points in the market. This versatile indicator combines multiple analytical elements to provide a comprehensive view of market conditions.
Why It’s Unique:
🔵KEY FEATURES
● Main Oscillator Line

● Histogram

● Confluence Arrows

● Trend Filter

● Overbought/Oversold Thresholds

● Signals
● Stop Levels

● Divergences

● Dashboard

🔵HOW TO USE
● Trend Identification
● Entry Signals
● Exit Signals
● Reversal Identification
● Confirmation
🔵CUSTOMIZATION
The Nautilus Oscillator offers several customization options to suit different trading styles:
By fine-tuning these settings, traders can adapt the Nautilus Oscillator to various market conditions and personal trading strategies.
The Nautilus Oscillator provides a multi-faceted approach to market analysis, combining trend identification, momentum assessment, and reversal detection in one comprehensive tool. Its visual cues and customizable features make it suitable for both novice and experienced traders across various timeframes and markets. The integration of multiple analytical elements – including the predictive histogram, confluence arrows, and adaptive trend filter – offers traders a rich set of data points to inform their trading decisions.
The Nautilus Oscillator by BigBeluga is an advanced technical analysis tool designed to help traders identify trend direction, strength, and potential reversal points in the market. This versatile indicator combines multiple analytical elements to provide a comprehensive view of market conditions.
Why It’s Unique:
- The Nautilus Oscillator is unique too, its blend of multiple technical analysis tools into a single, coherent indicator.
- By smoothing with a unique and highly valued in signal processing filter, and incorporating dynamic thresholds, this oscillator offers a more refined and adaptable approach to identifying trading signals.
- The filter is designed to have as flat a frequency response as possible in the passband. This means that within the range of frequencies it allows through, minimizes distortion and maintains the true shape of the signal more accurately than many other types of filters.
- The addition of a trend filter and divergence detection further enhances its capability, making it a versatile tool for both trend-following and reversal strategies. The built-in dashboard and clean chart management features provide traders with a streamlined, informative, and visually appealing trading experience. This makes the Nautilus Oscillator not just a tool for analysis but a comprehensive trading system in itself.
🔵KEY FEATURES
● Main Oscillator Line
- Smoothly transitions between bullish (green) and bearish (purple) colors
- Helps visualize mean-reversion, market trend, and momentum
● Histogram
- Displayed below the main oscillator line
- Represents the rate of change of the main oscillator
- Acts as a leading indicator, often showing changes faster than the main oscillator line
- Can be viewed as a predictive element, potentially indicating future movements of the main oscillator
- Histogram crossover signals (small dots) can indicate short-term momentum shifts
- Useful for early detection of potential trend changes or momentum shifts
● Confluence Arrows
- Arrows displayed above and below the oscillator
- Provide additional confluence signals that work in conjunction with the histogram
- Act as supplementary indicators to confirm the main oscillator signals
- Help in identifying stronger, more reliable trading opportunities when aligned with other indicator elements
● Trend Filter
- Displayed as horizontal lines above and below the oscillator
- Upper lines (above the oscillator): Indicate an uptrend
- Lower lines (below the oscillator): Indicate a downtrend
- Three lines appear when a strong trend is present
- Only one line is displayed when there's no trend
- Color-coded for easy identification (typically green for up, purple for down)
- Color intensity indicates the strength of the trend. More intensive color indicates stronger trend
- Provides a clear visual representation of the overall market trend
- Helps traders align their strategies with the broader market direction
● Overbought/Oversold Thresholds
- Can be set to static levels or dynamically adjust based on market volatility
- Helps identify potential reversal points in the market
● Signals
- Strong signals: Displayed as circles on both the oscillator and main chart (optional)
- Simple signals: Shown as X marks on both the oscillator and main chart (optional)
- Histogram crossover signals: Small dots on the histogram
● Stop Levels
- Optional feature that plots potential stop-loss levels for strong signals
- Based on the Market volatility for adaptability to different market conditions
● Divergences
- Identifies and displays bullish and bearish divergences between price and the oscillator
- Helps spot potential trend reversals
● Dashboard
- Provides at-a-glance information about current market conditions
- Displays trend direction, last signal, histogram direction, threshold mode, and divergence status
🔵HOW TO USE
● Trend Identification
- Use the main oscillator line color and position, along with the trend filter lines, to determine the overall market trend
● Entry Signals
- Strong signals (circles) suggest potential entry points in the direction of the trend
- Simple signals (X marks) can be used for more frequent, but potentially less reliable, entry opportunities
- Histogram crossover signals (dots) can indicate changes faster than the main oscillator line
- Look for alignment with confluence arrows for stronger entry signals
● Exit Signals
- Use the overbought/oversold thresholds as potential enter and exit points
- Stop levels (if enabled) provide dynamic exit points for risk management
● Reversal Identification
- Watch for divergences between price and the oscillator for potential trend reversals
- Pay attention to the histogram direction for early signs of momentum shifts
- Notice changes in the trend filter lines (from three lines to one, or vice versa)
● Confirmation
- Use the dashboard to quickly confirm the current market state and indicator readings
- Combine signals from different elements (main line, histogram, trend filter, confluence arrows) for stronger confirmation
🔵CUSTOMIZATION
The Nautilus Oscillator offers several customization options to suit different trading styles:
- Adjust the main oscillator length
- Set static or dynamic overbought/oversold thresholds
- Enable/disable and customize stop levels
- Toggle divergence display and adjust its parameters
- Show/hide the information dashboard
- Display simple signals on the main chart
By fine-tuning these settings, traders can adapt the Nautilus Oscillator to various market conditions and personal trading strategies.
The Nautilus Oscillator provides a multi-faceted approach to market analysis, combining trend identification, momentum assessment, and reversal detection in one comprehensive tool. Its visual cues and customizable features make it suitable for both novice and experienced traders across various timeframes and markets. The integration of multiple analytical elements – including the predictive histogram, confluence arrows, and adaptive trend filter – offers traders a rich set of data points to inform their trading decisions.
Note di rilascio
- Added AlertsNote di rilascio
The updated Nautilus Oscillator Pro now includes several advanced features to enhance its analytical power:- [] Money Flow Overlay: Tracks money flow directly on the oscillator, allowing traders to gauge liquidity and directional capital movement in the market.
[] Volume Rank Indicator: Highlights volume-based ranks within the oscillator, emphasizing periods of heightened or diminished activity to help identify potential breakout or consolidation zones. - Trend Bars with Directional Arrows: Displays directional arrows (>>>), both at the top and bottom of the oscillator, representing the trend direction of the main oscillator line. These arrows serve as a visual guide to follow the trend's momentum.
These additions provide a more comprehensive view of market behavior, combining volume, money flow, and trend signals directly within the oscillator for streamlined analysis and enhanced trading insights.
Note di rilascio
-Note di rilascio
-Note di rilascio
Core logic has been improved and refined . We have Added 10x analysis
we have added Volume Mapping
We have added Nautilus Map
We have added Gapped Nautilus
We have added Trading Style Presets
added Peak Signals with its alerts .
refined the visuals
Note di rilascio
Fixed Minor bugs Note di rilascio
Typo Bug fixed , along with few more minor bugs Note di rilascio
- Minor Alerts bug fixNote di rilascio
Update 1.3.1- Update Alerts message placeholders to {{close}}, {{trigger}} etc
- TrendSync Feature Styling
- OB/OS signals rename BUY/SELL
Note di rilascio
Money flow update: - MFI Divergence
- MFI Bullish/Bearish Alerts
- MFI Bullish/Bearish Divergence Alerts
Disponibile nello spazio a pagamento
Questo indicatore è disponibile solo per gli abbonati The Beluga Collection. Iscriviti per accedere a questo e ad altri script di BigBeluga.
🔵Gain access to our powerful tools : bigbeluga.com/tv
🔵Join our free discord for updates : bigbeluga.com/discord
All scripts & content provided by BigBeluga are for informational & educational purposes only.
🔵Join our free discord for updates : bigbeluga.com/discord
All scripts & content provided by BigBeluga are for informational & educational purposes only.
Declinazione di responsabilità
Le informazioni e le pubblicazioni non sono intese come, e non costituiscono, consulenza o raccomandazioni finanziarie, di investimento, di trading o di altro tipo fornite o approvate da TradingView. Per ulteriori informazioni, consultare i Termini di utilizzo.