PROTECTED SOURCE SCRIPT
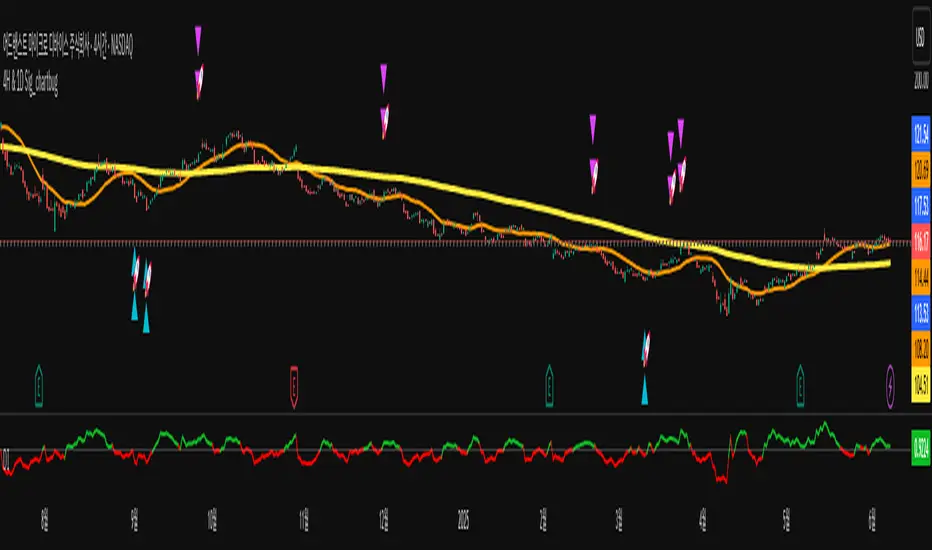
4H & 1D Sig_chartbug
Rohmoohyun is alive
Auxiliary Indicator for Buy/Sell Signals Using Bollinger Bands and Moving Averages.
Recommended for NASDAQ, Gold, Oil, BTC, Stocks on 4-hour or higher timeframes.
For Ethereum, Ripple, and other volatile altcoins, it is advisable to also check the daily chart.
Indicator Idea: This strategy utilizes two types of indicators: Bollinger Bands as a volatility (or momentum) indicator, and Moving Averages as a trend indicator. A triangle signal is generated in zones where the Bollinger Bands converge (squeeze). After a candle closes, a Rocket icon will appear, at which point a trading strategy can be devised based on the prevailing trend indicated by the Moving Averages.
Indicator Feature: When used on timeframes of 4 hours or higher, this indicator is extremely powerful for establishing trading criteria, especially when combined with trend analysis and support/resistance zones.
Basic Trading Method: Enter a position at the Rocket icon + Immediately set a stop-loss (e.g., at the previous low/high, a maximum loss threshold like 2% of capital, or at a level planned for a second entry to average down) + Take partial profit (e.g., 50%) at your desired TP level, then move the stop-loss to your entry price (break-even) and hold the remainder of the position.
Recommended Timeframes: 5-minute, 4-hour, 1-day.
Trading Strategy
Pullback Trading / Trend Reversal Trading.
Instrument Selection (Commodities & Indices, Crypto, NASDAQ-listed Stocks).
Understand Instrument Characteristics (The three categories behave differently, so backtesting before use is essential).
a) Bullish Alignment (Price > 20MA > 200MA)
: Focus primarily on long (buy) positions.
: If attempting a counter-trend (short) trade, do so only with multiple confirmations, such as RSI/Disparity divergence and a major resistance zone. Use a tight stop-loss.
b) Bearish Alignment (Price < 20MA < 200MA)
: The opposite of the above; focus on short (sell) positions.
c) During a Bullish Trend, Price is Between MAs (200MA < Price < 20MA)
: This indicates either a consolidation phase within an uptrend or a potential early sign of a reversal to a downtrend. Consider both possibilities.
: A possible approach is to allocate capital with a 60% bias to long positions and a 40% bias to short positions (unlike in full bullish/bearish alignments where counter-trend trading has a poor risk/reward ratio).
: If it turns out to be a reversal point, you can enter a position at the very beginning of a new trend, allowing for a longer ride.
: It's recommended to take partial profits rather than closing the entire position. For instance, close half and move the stop-loss to your entry price to eliminate risk while keeping profit potential open.
d) During a Bearish Trend, Price is Between MAs (200MA > Price > 20MA)
: The opposite of the above.
Instrument-Specific Characteristics
Commodities & Indices (NASDAQ, Oil, Gold)
: The indicator was primarily developed and tested on NASDAQ and Gold, so it tends to work well with them.
: However, NASDAQ often exhibits strong, one-way trends, so a trend-following approach is highly recommended.
: Gold and Oil tend to have significant reversals from key support/resistance zones.
Crypto
: These assets are extremely volatile, so use this indicator with caution and skill.
: It performs reasonably well with BTC. For anything from Ethereum downwards, the price action can be chaotic, so it's crucial to use the daily chart and other confirming factors.
: Instead of frequent day trading, focus on long-term positions, reduce the number of trades, and aim for entries with a good average price.
NASDAQ-listed Stocks
: Recommended for a long-term, accumulation-style investment approach.
: Use the indicator not as a signal that "it will pump immediately!" but rather as a sign that "this is a decent entry point to build a position."
: Alternatively, it can be used for more active swing trading (buy, sell, repeat).
Important Disclaimers
This is an auxiliary indicator, as the name implies. Do not trust it blindly.
When entering a position, immediately set your stop-loss or have a plan for a single additional entry (max one recommended).
Always use it in conjunction with other forms of analysis.
Track your performance (win rate, risk/reward ratio) based on this strategy.
Continuously refine and improve your approach.
Script protetto
Questo script è pubblicato come codice protetto. Tuttavia, è possibile utilizzarle liberamente e senza alcuna limitazione – ulteriori informazioni qui.
Declinazione di responsabilità
Le informazioni e le pubblicazioni non sono intese come, e non costituiscono, consulenza o raccomandazioni finanziarie, di investimento, di trading o di altro tipo fornite o approvate da TradingView. Per ulteriori informazioni, consultare i Termini di utilizzo.