PROTECTED SOURCE SCRIPT
Aggiornato Bitcoin Heatmap (by Alex L.)
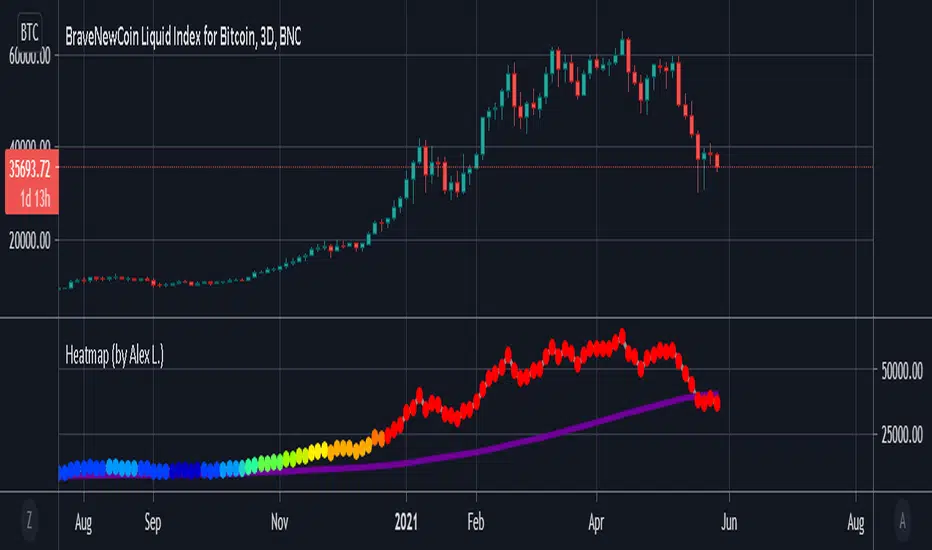
This indicator is a based on "200 Week Moving Average Heatmap" by Plan B. It shows "heatmap" of a security based on % increase of its 200 week (or other) moving average. It can be used for Bitcoin, as well identifying overheated Stocks (like TSLA). Plan B designed this indicator for Bitcoin using MA = 1400 (which is 200 trading days in Crypto), I personally found it useful to indicate overheated Stock Market stocks using MA = 250 (which is ~1 year of net trading days, excluding weekends and holidays).
Enjoy!
Enjoy!
Note di rilascio
Fix for edge case where if smaller MA was used (not the default 1400) and if MA % of a certain bar was more than 100% then "Heatmap" circle would not be painted in "red", now it will be.Script protetto
Questo script è pubblicato come codice protetto. Tuttavia, è possibile utilizzarle liberamente e senza alcuna limitazione – ulteriori informazioni qui.
Declinazione di responsabilità
Le informazioni e le pubblicazioni non sono intese come, e non costituiscono, consulenza o raccomandazioni finanziarie, di investimento, di trading o di altro tipo fornite o approvate da TradingView. Per ulteriori informazioni, consultare i Termini di utilizzo.
Script protetto
Questo script è pubblicato come codice protetto. Tuttavia, è possibile utilizzarle liberamente e senza alcuna limitazione – ulteriori informazioni qui.
Declinazione di responsabilità
Le informazioni e le pubblicazioni non sono intese come, e non costituiscono, consulenza o raccomandazioni finanziarie, di investimento, di trading o di altro tipo fornite o approvate da TradingView. Per ulteriori informazioni, consultare i Termini di utilizzo.