OPEN-SOURCE SCRIPT
Aggiornato Smart Adaptive MACD
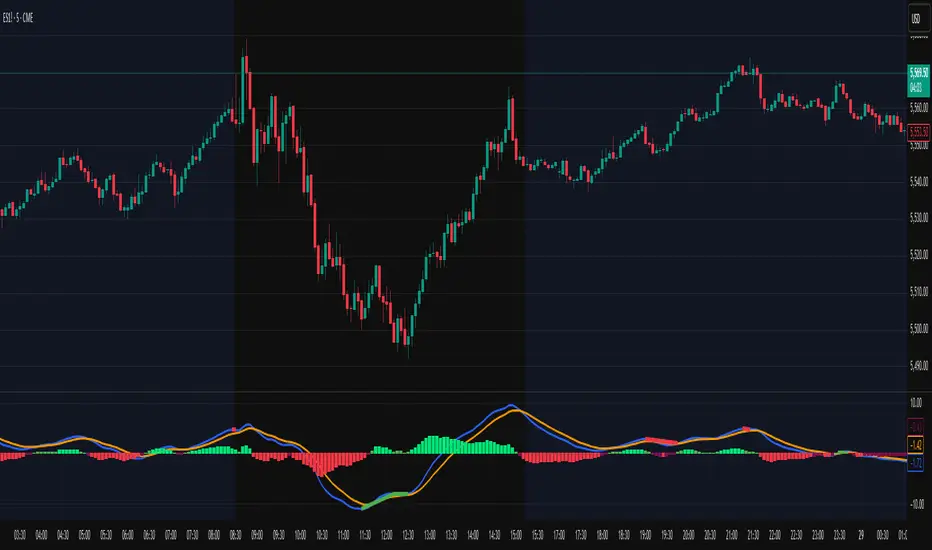
An advanced MACD variant that dynamically adapts to market volatility using ATR-based scaling.
Key Features:
Volatility-sensitive MACD and Signal lengths
Optional smoothed MACD line
Dynamic histogram heatmap (strong vs. weak momentum)
Built-in Regular and Hidden Divergence detection
Clear visual signals via solid (regular) and dashed (hidden) divergence lines
What makes this different:
Unlike traditional MACD indicators with fixed-length settings, this version adapts in real time
to changing volatility conditions. It shortens during high-momentum environments for faster
reaction, and lengthens during low-volatility phases to reduce noise. This allows better
alignment with market behavior and cleaner momentum signals.
Divergence Detection – How It Works
The Smart Adaptive MACD detects both regular and hidden divergences by comparing price action with the smoothed MACD line. It uses recent pivot highs and lows to evaluate divergence and draws lines on the chart when conditions are met.
Regular Divergence Detection
This type of divergence signals potential reversals. It occurs when the price moves in one
direction while the MACD moves in the opposite.
Bullish Regular Divergence:
Price makes lower lows, but MACD makes higher lows.
Result: A solid green line is plotted beneath the MACD curve.
Bearish Regular Divergence:
Price makes higher highs, but MACD makes lower highs.
Result: A solid red line is plotted above the MACD curve.
Hidden Divergence Detection
This type of divergence signals trend continuation. It occurs when price pulls back slightly,
but the MACD shows deeper movement in the opposite direction.
Bullish Hidden Divergence:
Price makes higher lows, but MACD makes lower lows.
Result: A dashed green line is plotted below the MACD curve.
Bearish Hidden Divergence:
Price makes lower highs, but MACD makes higher highs.
Result: A dashed red line is plotted above the MACD curve.
How to Use:
This tool is best used alongside price structure, key support/resistance levels, or as a
secondary confirmation for your trend or reversal strategy. It is designed to enhance your
interpretation of market momentum and divergence without needing extra chart clutter.
Disclaimer:
This script is provided for educational and informational purposes only. It is not intended as
financial advice or a recommendation to buy or sell any asset. Always conduct your own
research and consult with a licensed financial advisor before making trading decisions. Use
at your own risk.
License:
This script is published under the Mozilla Public License 2.0 and is fully open-source.
Built by AresIQ | 2025
Note di rilascio
Small clean upScript open-source
Nello spirito di TradingView, l'autore di questo script lo ha reso open source, in modo che i trader possano esaminarne e verificarne la funzionalità. Complimenti all'autore! Sebbene sia possibile utilizzarlo gratuitamente, ricordiamo che la ripubblicazione del codice è soggetta al nostro Regolamento.
Declinazione di responsabilità
Le informazioni e le pubblicazioni non sono intese come, e non costituiscono, consulenza o raccomandazioni finanziarie, di investimento, di trading o di altro tipo fornite o approvate da TradingView. Per ulteriori informazioni, consultare i Termini di utilizzo.
Script open-source
Nello spirito di TradingView, l'autore di questo script lo ha reso open source, in modo che i trader possano esaminarne e verificarne la funzionalità. Complimenti all'autore! Sebbene sia possibile utilizzarlo gratuitamente, ricordiamo che la ripubblicazione del codice è soggetta al nostro Regolamento.
Declinazione di responsabilità
Le informazioni e le pubblicazioni non sono intese come, e non costituiscono, consulenza o raccomandazioni finanziarie, di investimento, di trading o di altro tipo fornite o approvate da TradingView. Per ulteriori informazioni, consultare i Termini di utilizzo.