OPEN-SOURCE SCRIPT
Aggiornato BKLevels

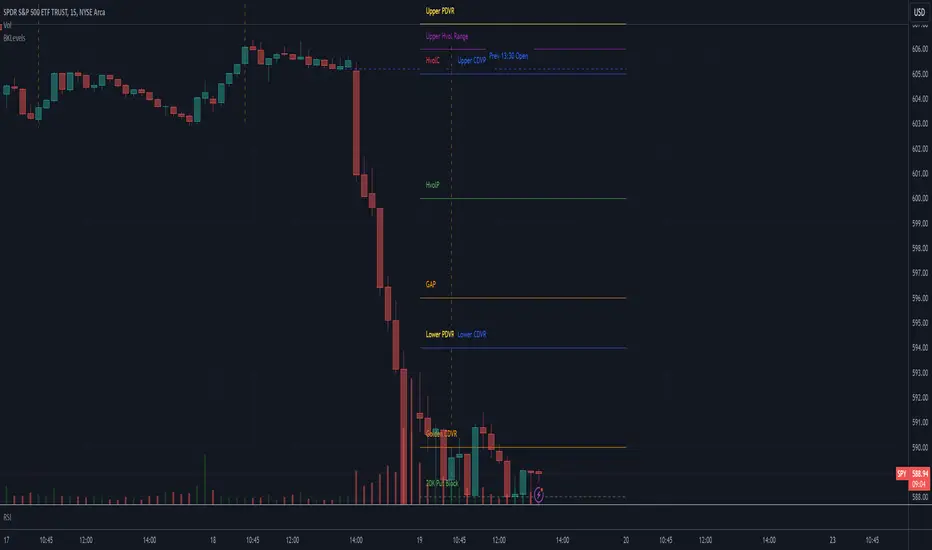
This displays levels from a text input, levels from certain times on the previous day, and high/low/close from previous day. The levels are drawn for the date in the first line of the text input. Newlines are required between each level
Example text input:
Pine Script®
For each line, the format is <ticker>,<price>,<color#>,<line pixel width>,<description>,<line style>
For color, there are 9 possible user- configurable colors- so you can input numbers 1 through 9
For line style, the possible inputs are:
"FIRM" -> solid line
"SHORT_DASH" -> dotted line
"MEDIUM_DASH" -> dashed line
"LONG_DASH" -> dashed line
Example text input:
2024-12-17
SPY,606,5,1,Lower Hvol Range,FIRM
SPY,611,1,1,Last 20K CBlock,FIRM
SPY,600,2,1,Last 20K PBlock,FIRM
SPX,6085,1,1,HvolC,FIRM
SPX,6080,2,1,HvolP,FIRM
SPX,6095,3,1,Upper PDVR,FIRM
SPX,6060,3,1,Lower PDVR,FIRM
For each line, the format is <ticker>,<price>,<color#>,<line pixel width>,<description>,<line style>
For color, there are 9 possible user- configurable colors- so you can input numbers 1 through 9
For line style, the possible inputs are:
"FIRM" -> solid line
"SHORT_DASH" -> dotted line
"MEDIUM_DASH" -> dashed line
"LONG_DASH" -> dashed line
Note di rilascio
This displays levels from a text input, levels from certain times on the previous day, and high/low/close from previous day. The levels are drawn for the date in the first line of the text input. Newlines are required between each levelExample text input:
2024-12-17
SPY,606,5,1,Lower Hvol Range,FIRM
SPY,611,1,1,Last 20K CBlock,FIRM
SPY,600,2,1,Last 20K PBlock,FIRM
SPX,6085,1,1,HvolC,FIRM
SPX,6080,2,1,HvolP,FIRM
SPX,6095,3,1,Upper PDVR,FIRM
SPX,6060,3,1,Lower PDVR,FIRM
For each line, the format is <ticker>,<price>,<color#>,<line pixel width>,<description>,<line style>
For color, there are 9 possible user- configurable colors- so you can input numbers 1 through 9
For line style, the possible inputs are:
"FIRM" -> solid line
"SHORT_DASH" -> dotted line
"MEDIUM_DASH" -> dashed line
"LONG_DASH" -> dashed line
Updated 17Dec 17:00 PST to fiz empty line causing crash
Note di rilascio
- Fixed bugginess with labels and offsets. Label offsets are now in hours, not bars- Added midnight level
- 10:30 line was supposed to be vertical, this is changed
Note di rilascio
Fix timezone issue for futuresNote di rilascio
Add translation for NQScript open-source
Nello spirito di TradingView, l'autore di questo script lo ha reso open source, in modo che i trader possano esaminarne e verificarne la funzionalità. Complimenti all'autore! Sebbene sia possibile utilizzarlo gratuitamente, ricordiamo che la ripubblicazione del codice è soggetta al nostro Regolamento.
Declinazione di responsabilità
Le informazioni e le pubblicazioni non sono intese come, e non costituiscono, consulenza o raccomandazioni finanziarie, di investimento, di trading o di altro tipo fornite o approvate da TradingView. Per ulteriori informazioni, consultare i Termini di utilizzo.
Script open-source
Nello spirito di TradingView, l'autore di questo script lo ha reso open source, in modo che i trader possano esaminarne e verificarne la funzionalità. Complimenti all'autore! Sebbene sia possibile utilizzarlo gratuitamente, ricordiamo che la ripubblicazione del codice è soggetta al nostro Regolamento.
Declinazione di responsabilità
Le informazioni e le pubblicazioni non sono intese come, e non costituiscono, consulenza o raccomandazioni finanziarie, di investimento, di trading o di altro tipo fornite o approvate da TradingView. Per ulteriori informazioni, consultare i Termini di utilizzo.