OPEN-SOURCE SCRIPT
STY-Divergence
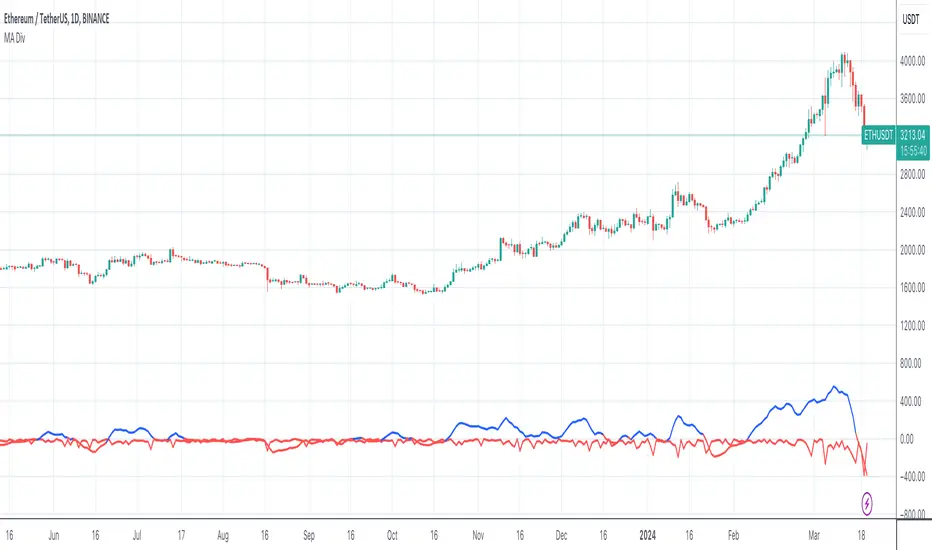
draws a blue line representing the divergence between a 3-period moving average (3MA) close and the current candle high, and a red line representing the divergence between a 20-period moving average (20MA) close and the 3MA close
This script calculates the moving averages for both 3-period and 20-period and then computes the divergences as described. It plots the lines with blue color if the divergence is positive and red if negative. Adjust the length of moving averages or other parameters according to your preference.
This script calculates the moving averages for both 3-period and 20-period and then computes the divergences as described. It plots the lines with blue color if the divergence is positive and red if negative. Adjust the length of moving averages or other parameters according to your preference.
Script open-source
Nello spirito di TradingView, l'autore di questo script lo ha reso open source, in modo che i trader possano esaminarne e verificarne la funzionalità. Complimenti all'autore! Sebbene sia possibile utilizzarlo gratuitamente, ricordiamo che la ripubblicazione del codice è soggetta al nostro Regolamento.
Declinazione di responsabilità
Le informazioni e le pubblicazioni non sono intese come, e non costituiscono, consulenza o raccomandazioni finanziarie, di investimento, di trading o di altro tipo fornite o approvate da TradingView. Per ulteriori informazioni, consultare i Termini di utilizzo.