[volfgang] WAVE Scanner
This indicator operates on a series of inputs and global variable declarations. Based on the same parameters as the [volfgang] WAVE Indicator. It uses different parameters such as the closing price, Stochastic Momentum Index, and smoothing factors such as the EMA to calculate the potential trade signals.
The scanner allows you to adjust the thresholds for bullish and bearish counts, which can be tailored to your personal trading strategy.
The minimum value is 4 and maximum is 8.
In total you can use 8 different timeframes for your signals from the following;
- 3D
- 1D
- 12h
- 8h
- 4h
- 1h
- 15m
- 5m
The scanner's unique ability to scan across multiple timeframes is what makes this indicator unique. This multi timeframe analysis can be incredibly useful for identifying broader trends in the market.
The Wave Scanner settings also includes inputs for you to enter risk management settings, including your total capital and the risk percentage you are willing to take per trade. It uses this information to display data in a label on the chart including;
- Position Size
- Stop Loss Level
- Potential Profit
- Risk Reward Ratio
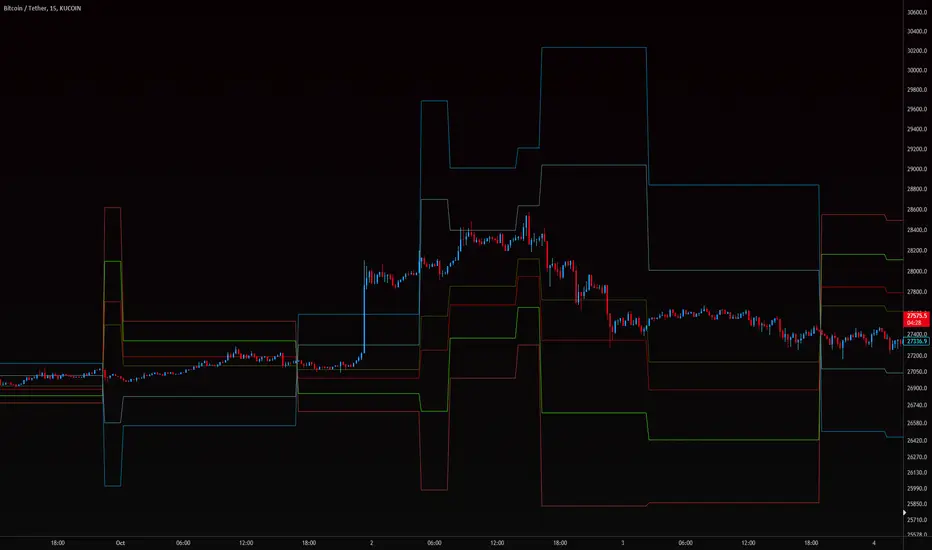
On your chart, the WAVE Scanner will plot the ideal Entry Levels, Stop Loss and Take Profit Levels by calculating Fibonacci Levels, which is a popular tool for identifying potential support and resistance levels.
These are marked as follows;
- GREEN Lines: Entry Levels
- PINK Line: Stop Loss (can be customized in the settings)
- GREY Line: Breakeven Level (move SL to breakeven at this level)
- BLUE Line: Take Profit Level
So, if you're a trader looking to level up your strategy, the Wave Scanner is a tool you won't want to miss out on.
Plot Display Option: Added a checkbox input to control the display lines on the chart.
Risk Management: Added a more sophisticated risk management system. Specifically, setting the stop loss as a multiple of the ATR, thus increasing potential RR.
Stop Loss Multiplier Input: You can modify the multiple of ATR that the Stop Loss is calculated with inside the settings. This is set to 0.618 as default but can be increase up to a maximum of 2.
IMPORTANT NOTE: The WaveScanner is designed for lower timeframes. I've performed extensive backtesting which showed it to be quite inaccurate across the medium timeframes so I've decided to disable it on those and made it available only on the following timeframes, on all other timeframes the indicator will be hidden from your chart.
Available Timeframes: 1m, 5m, 10m, 15m, 20m, 30, 1H, Daily, 3D, 5D, Weekly
- The Scanner now uses the ATR to more accurately map out Entries, Stop Loss and Take Profit levels.
- The label also shows Higher Time Frame [HTF] and Lower Time Frame [LTF] bias according to the WAVE.
- The label will also tell you how much profit you will make if you close your trade at the BE level or at the TP level, this is calculated according to the amount you risk which is entered in the input settings.
- Added support for Hidden Bullish/Bearish Divergence Buy/Sell signals.
Instead of showing 3 Entry Levels, the Scanner now shows 2 Entry Levels and 2 different Stop Loss levels, this gives the user two possible trade ideas. One being the aggressive entry and the other a more conservative entry.
One should use the WAVE indicator in conjunction with the Scanner to time the best entries and exits.
Script su invito
Solo gli utenti autorizzati dall'autore hanno accesso a questo script e ciò richiede solitamente un pagamento. Puoi aggiungere lo script ai tuoi preferiti, ma potrai utilizzarlo solo dopo aver richiesto l'autorizzazione e averla ottenuta dal suo autore - per saperne di più leggi qui. Per maggiori dettagli, segui le istruzioni dell'autore qui sotto o contatta direttamente Volfgang.
TradingView NON consiglia di pagare o utilizzare uno script a meno che non ci si fidi pienamente del suo autore e non si comprenda il suo funzionamento. Puoi anche trovare alternative gratuite e open-source nei nostri script della comunità.
Istruzioni dell'autore
Attenzione: prima di richiedere l'accesso, leggi la nostra guida per gli script su invito.
Declinazione di responsabilità
Script su invito
Solo gli utenti autorizzati dall'autore hanno accesso a questo script e ciò richiede solitamente un pagamento. Puoi aggiungere lo script ai tuoi preferiti, ma potrai utilizzarlo solo dopo aver richiesto l'autorizzazione e averla ottenuta dal suo autore - per saperne di più leggi qui. Per maggiori dettagli, segui le istruzioni dell'autore qui sotto o contatta direttamente Volfgang.
TradingView NON consiglia di pagare o utilizzare uno script a meno che non ci si fidi pienamente del suo autore e non si comprenda il suo funzionamento. Puoi anche trovare alternative gratuite e open-source nei nostri script della comunità.
Istruzioni dell'autore
Attenzione: prima di richiedere l'accesso, leggi la nostra guida per gli script su invito.