OPEN-SOURCE SCRIPT
High Volume Engulfing Candle near EMAs
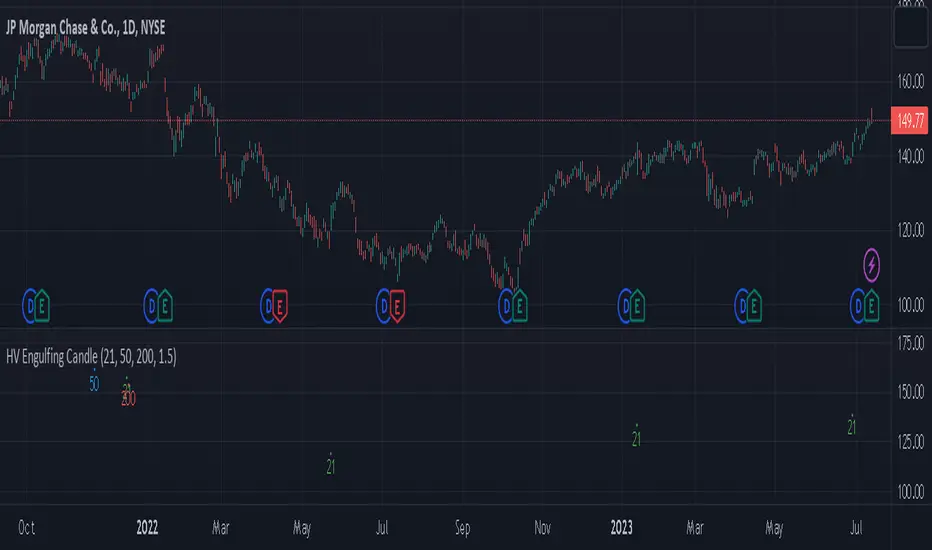
The indicator is designed to identify and signal instances of high volume and engulfing candles near three Exponential Moving Averages (EMAs): the 21EMA, 50EMA, and 200EMA. It can be used in various financial markets such as stocks, forex, commodities, or cryptocurrencies, as long as the market data is available on the TradingView platform.
Here's a breakdown of how the indicator works and its features:
High Volume Detection: The indicator considers a candle to have high volume if its volume is greater than or equal to a specified threshold. The default threshold is set to 1.5 times the 20-period Simple Moving Average (SMA) of the volume. You can adjust the volume_threshold parameter to customize the threshold according to your preferences.
Engulfing Candle Detection: An engulfing candle is identified when the current candle's range engulfs the range of the previous candle. The indicator checks if the current candle is either bullish engulfing (open[1] > close[1] and close > open[1]) or bearish engulfing (open[1] < close[1] and close < open[1]). This helps identify significant shifts in market sentiment.
Proximity to EMAs: The indicator checks if the low of the candle is below and the high is above each of the three EMAs (21EMA, 50EMA, and 200EMA). This indicates that the price action is near or interacting with these key moving averages.
When all the following conditions are met, the indicator plots shapes below the candlesticks on the chart to generate signals:
The candle has high volume (volume_threshold).
The candle is an engulfing candle.
The candle's range engulfs the 21EMA, 50EMA, or 200EMA.
The shapes are plotted with different colors and labels to indicate which EMA condition is met. Green shapes represent the 21EMA condition, blue shapes represent the 50EMA condition, and red shapes represent the 200EMA condition.
By using this indicator, traders can potentially identify significant market movements, areas of price interaction with key EMAs, and instances of high volume that may signify strong buying or selling pressure.
Script open-source
Nello spirito di TradingView, l'autore di questo script lo ha reso open source, in modo che i trader possano esaminarne e verificarne la funzionalità. Complimenti all'autore! Sebbene sia possibile utilizzarlo gratuitamente, ricordiamo che la ripubblicazione del codice è soggetta al nostro Regolamento.
Declinazione di responsabilità
Le informazioni e le pubblicazioni non sono intese come, e non costituiscono, consulenza o raccomandazioni finanziarie, di investimento, di trading o di altro tipo fornite o approvate da TradingView. Per ulteriori informazioni, consultare i Termini di utilizzo.