PROTECTED SOURCE SCRIPT
Aggiornato CANDLE SCRUTINY | GSK-VIZAG-AP-INDIA
Indicator: CANDLE SCRUTINY | GSK-VIZAG-AP-INDIA
1. Overview
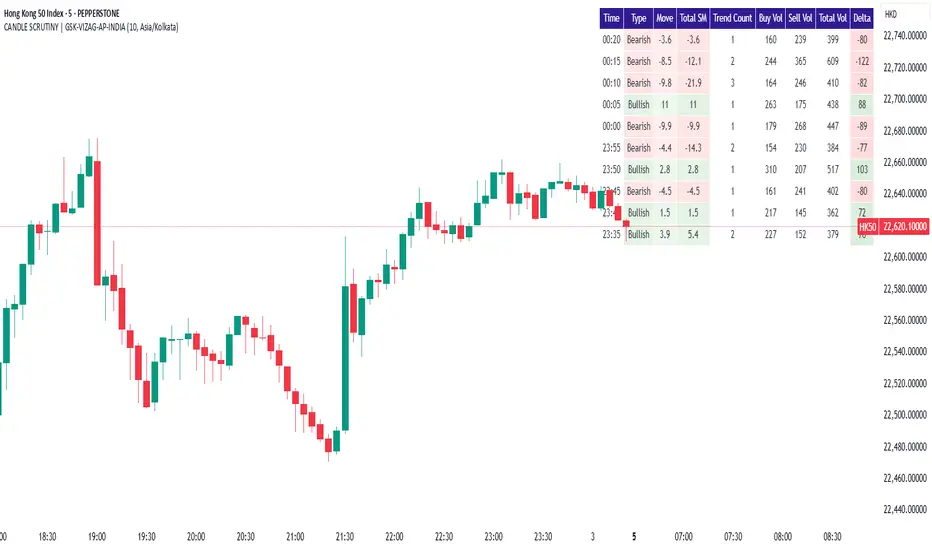
The CANDLE SCRUTINY indicator is a candle-by-candle analytical tool designed to dissect and visually represent the behavior of recent candles on a chart. It presents a concise table overlay that summarizes critical candlestick data including price movement, directional trend, volume dynamics, and strength of price sequences — all updated in real time.
2. Purpose / Trading Use Case
This tool is ideal for:
Scalpers and intraday traders needing quick real-time candle insights.
Trend analyzers who want to observe evolving price momentum.
Volume-based decision makers monitoring buyer-seller imbalance.
Traders who scrutinize candles for confirmations before entries or exits.
3. Key Features & Logic Breakdown
Candle Classification: Each candle is categorized as Bullish, Bearish, or Doji based on open-close comparison.
Move Calculation: Calculates and displays net candle move (Close - Open) for each bar.
Trend Count: Tracks the number of consecutive candles of the same type (bullish or bearish).
Sequential Move (Total SM): Aggregates move values when candles of the same type form a sequence.
Volume Breakdown: Approximates buy/sell volume ratio using candle type logic.
Delta Volume: Measures buy-sell imbalance to gauge intrabar strength.
Time Localization: Candle timestamps are shown in the user-selected timezone.
4. User Inputs / Settings
Number of Candles (numCandles): Choose how many recent candles to analyze (1–10).
Table Position (tablePos): Set to top_right by default.
Timezone Selector (tzOption): Choose from multiple global timezones (e.g., IST, UTC, NY, London) to view local candle times.
These settings let traders customize the scope and perspective of candle analysis to fit their trading region and strategy focus.
5. Visual & Plotting Elements
A floating data table appears on the chart (top-right by default), showing:
Time of candle (localized)
Type (Bullish/Bearish/Doji)
Move value with green/red background
Total SM (sequential movement) with trend-based color shading
Trend Count
Buy Volume, Sell Volume, Total Volume
Delta (volume imbalance) with color-coded strength indicator
Color coding makes it visually intuitive to quickly assess strength, direction, and sequence.
6. Effective Usage Tips
Use in 1-minute to 15-minute timeframes for scalping or momentum breakout confirmation.
Monitor Delta and Sequential Move (SM) to confirm strength behind price action.
Trend Count helps gauge sustained direction—useful for short-term trend continuation strategies.
Combine with support/resistance zones or volume profile for stronger confluence.
Great for detecting early signs of exhaustion or continuation.
7. What Makes It Unique
Combines price action + volume behavior + trend memory into one compact visual table.
Allows user-defined timezone adjustment, a rare feature in similar indicators.
Designed to give a story of the last N candles from a momentum and participation viewpoint.
Fully non-intrusive overlay—doesn't clutter chart space.
8. Alerts / Additional Features
Currently no alerts, but future versions may include:
Alert when trend count exceeds a threshold
Alert on strong delta volume shifts
Alert on back-to-back Dojis (sign of indecision)
9. Technical Concepts Used
Candlestick Logic: Bullish, Bearish, Doji classification
Volume Analysis: Approximate buy/sell split based on candle type
Color Coding: For intuitive interpretation of move, trend, and delta
Arrays & Looping Logic: Efficient tracking of trends and sequences
Timezone Handling: Uses hour(time, timezone) and minute(time, timezone) for local display
10. Disclaimer
This script is provided for educational and informational purposes only. It does not constitute financial advice. Always backtest thoroughly and use appropriate risk management when applying this or any indicator in live markets. The author is not responsible for any financial losses incurred.
1. Overview
The CANDLE SCRUTINY indicator is a candle-by-candle analytical tool designed to dissect and visually represent the behavior of recent candles on a chart. It presents a concise table overlay that summarizes critical candlestick data including price movement, directional trend, volume dynamics, and strength of price sequences — all updated in real time.
2. Purpose / Trading Use Case
This tool is ideal for:
Scalpers and intraday traders needing quick real-time candle insights.
Trend analyzers who want to observe evolving price momentum.
Volume-based decision makers monitoring buyer-seller imbalance.
Traders who scrutinize candles for confirmations before entries or exits.
3. Key Features & Logic Breakdown
Candle Classification: Each candle is categorized as Bullish, Bearish, or Doji based on open-close comparison.
Move Calculation: Calculates and displays net candle move (Close - Open) for each bar.
Trend Count: Tracks the number of consecutive candles of the same type (bullish or bearish).
Sequential Move (Total SM): Aggregates move values when candles of the same type form a sequence.
Volume Breakdown: Approximates buy/sell volume ratio using candle type logic.
Delta Volume: Measures buy-sell imbalance to gauge intrabar strength.
Time Localization: Candle timestamps are shown in the user-selected timezone.
4. User Inputs / Settings
Number of Candles (numCandles): Choose how many recent candles to analyze (1–10).
Table Position (tablePos): Set to top_right by default.
Timezone Selector (tzOption): Choose from multiple global timezones (e.g., IST, UTC, NY, London) to view local candle times.
These settings let traders customize the scope and perspective of candle analysis to fit their trading region and strategy focus.
5. Visual & Plotting Elements
A floating data table appears on the chart (top-right by default), showing:
Time of candle (localized)
Type (Bullish/Bearish/Doji)
Move value with green/red background
Total SM (sequential movement) with trend-based color shading
Trend Count
Buy Volume, Sell Volume, Total Volume
Delta (volume imbalance) with color-coded strength indicator
Color coding makes it visually intuitive to quickly assess strength, direction, and sequence.
6. Effective Usage Tips
Use in 1-minute to 15-minute timeframes for scalping or momentum breakout confirmation.
Monitor Delta and Sequential Move (SM) to confirm strength behind price action.
Trend Count helps gauge sustained direction—useful for short-term trend continuation strategies.
Combine with support/resistance zones or volume profile for stronger confluence.
Great for detecting early signs of exhaustion or continuation.
7. What Makes It Unique
Combines price action + volume behavior + trend memory into one compact visual table.
Allows user-defined timezone adjustment, a rare feature in similar indicators.
Designed to give a story of the last N candles from a momentum and participation viewpoint.
Fully non-intrusive overlay—doesn't clutter chart space.
8. Alerts / Additional Features
Currently no alerts, but future versions may include:
Alert when trend count exceeds a threshold
Alert on strong delta volume shifts
Alert on back-to-back Dojis (sign of indecision)
9. Technical Concepts Used
Candlestick Logic: Bullish, Bearish, Doji classification
Volume Analysis: Approximate buy/sell split based on candle type
Color Coding: For intuitive interpretation of move, trend, and delta
Arrays & Looping Logic: Efficient tracking of trends and sequences
Timezone Handling: Uses hour(time, timezone) and minute(time, timezone) for local display
10. Disclaimer
This script is provided for educational and informational purposes only. It does not constitute financial advice. Always backtest thoroughly and use appropriate risk management when applying this or any indicator in live markets. The author is not responsible for any financial losses incurred.
Note di rilascio
Time Zone Control: "Your Clock, Your Time!" (The displayTimezone input)Old Version (Sometimes): The time displayed in your table might have been in the chart's exchange time zone, or a default one, which could be confusing if you're trading from a different part of the world.
New Feature: We added a new option in the indicator settings where you can choose your preferred time zone (like "Asia/Kolkata", "New York", "London", etc.).
Result: The "Time" column in your table now shows the candle's time precisely in your chosen time zone, making it much easier to read and relate to your local trading hours.
Old Version (Simplified): You had a simpler way to split total volume into "Buy Vol" and "Sell Vol" – usually just a fixed percentage (e.g., 60% for bullish, 40% for bearish).
New Calculation: We brought back a more sophisticated method. This method looks at where the candle's closing price is within its entire high-to-low range.
For example, if a bullish candle closes very high in its range, a larger portion of its volume is considered "Buy Vol." If a bearish candle closes very low, more volume is "Sell Vol." If it's a small "Doji" candle, it splits the volume evenly.
Result: The "Buy Vol", "Sell Vol", and "Delta" numbers are now based on a more nuanced and common method in trading analysis, potentially giving you a more realistic view of buying and selling pressure within each candle.
Script protetto
Questo script è pubblicato come codice protetto. Tuttavia, è possibile utilizzarle liberamente e senza alcuna limitazione – ulteriori informazioni qui.
"Created by GSK-VIZAG-AP-INDIA"
Declinazione di responsabilità
Le informazioni e le pubblicazioni non sono intese come, e non costituiscono, consulenza o raccomandazioni finanziarie, di investimento, di trading o di altro tipo fornite o approvate da TradingView. Per ulteriori informazioni, consultare i Termini di utilizzo.