OPEN-SOURCE SCRIPT
Multi-Timeframe Pivot Points
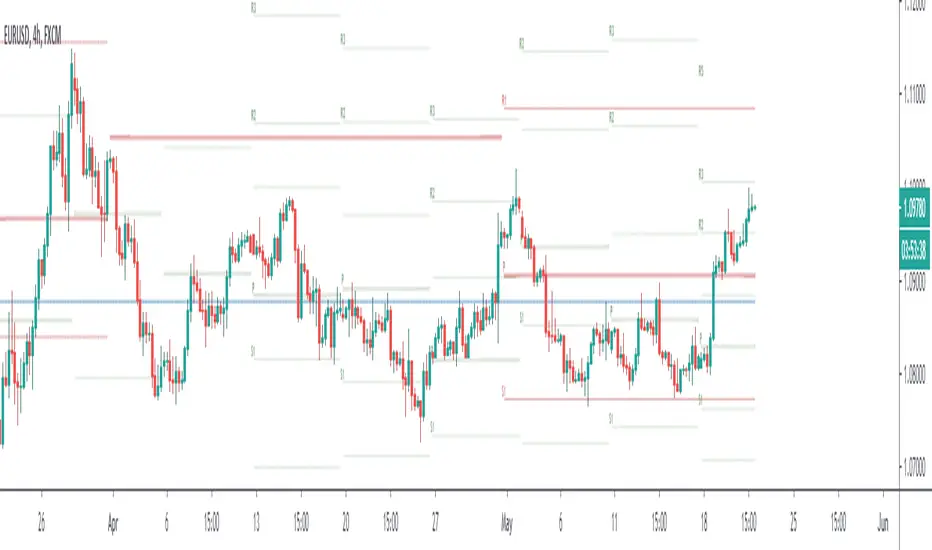
This is a MTF pivot point indicator. I was unhappy with the standard pivot point indicator in Trading View as I wanted to be aware of how price was interacting with pivot points on a higher timeframe. For example, if I'm on the 1H time frame looking at daily pivots, I want to be sure that my trading plan to move between these pivots does not contradict what price is trying to do in relation to the weekly pivots. In addition, sometimes daily and weekly pivots will align increasing probability of a bounce
Ultimately its about trying to automate as much as possible to quickly have an awareness of what might be happening on the timeframe above without having to manual enter levels.
I concluded I don't like the results of this script - whilst i clearly see price interacting with pivots on the current timeframe and higher timeframes there is too much screen clutter on the screen for me.
Rather than delete the script I thought I'd make it available for other people to use. I hope its useful to people. Good luck
(For the record it actually takes a little thinking outside the box to make so many pivots display - you can't just plot hlines. If your a pinescript geek you might like the code)
Script open-source
Nello spirito di TradingView, l'autore di questo script lo ha reso open source, in modo che i trader possano esaminarne e verificarne la funzionalità. Complimenti all'autore! Sebbene sia possibile utilizzarlo gratuitamente, ricordiamo che la ripubblicazione del codice è soggetta al nostro Regolamento.
Declinazione di responsabilità
Le informazioni e le pubblicazioni non sono intese come, e non costituiscono, consulenza o raccomandazioni finanziarie, di investimento, di trading o di altro tipo fornite o approvate da TradingView. Per ulteriori informazioni, consultare i Termini di utilizzo.