OPEN-SOURCE SCRIPT
Aggiornato Machine Learning Breakouts (from Pivots)
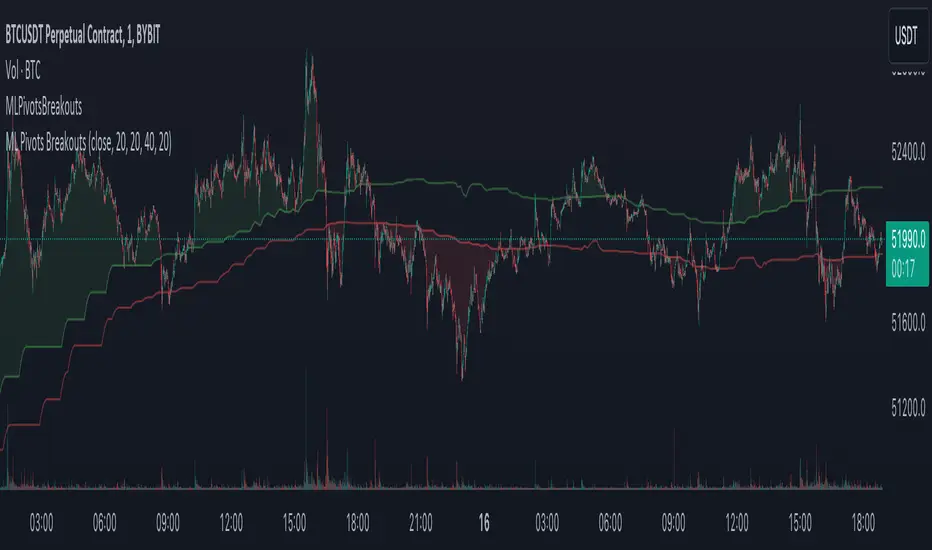
I developed the 'Machine Learning Breakouts (from Pivots)' indicator to revolutionize the way we detect breakout opportunities and follow trend, harnessing the power of pivot points and machine learning. This tool integrates the k-Nearest Neighbors (k-NN) method with the Euclidean distance algorithm, meticulously analyzing pivot points to accurately forecast multiple breakout paths/zones. "ML Pivots Breakouts" is designed to identify and visually alert traders on bullish breakouts above high lines and bearish breakouts below low lines, offering essential insights for breakout and trend follower traders.
For traders, the instruction is clear: a bullish breakout signal is given when the price crosses above the forecasted high line, indicating potential entry points for long positions. Conversely, a bearish breakout signal is provided when the price breaks below the forecasted low line, suggesting opportunities to enter short positions. This makes the indicator a vital asset for navigating through market volatilities and capitalizing on emerging trends, designed for both long and short strategies and adeptly adapting to market shifts.
In this indicator I operate in a two-dimensional space defined by price and time. The choice of Euclidean distance as the preferred method for this analysis hinges on its simplicity and effectiveness in measuring and predicting straight-line distances between points in this space.
The Machine Learning Breakouts (from Pivots) Indicator calculations have been transitioned to the MLPivotsBreakouts library, simplifying the process of integration. Users can now seamlessly incorporate the "breakouts" function into their scripts to conduct detailed momentum analysis with ease.
Note di rilascio
- Updated compiler annotations in the library for better documentation.
- Upgraded indicator to align with the new library version for improved clarity and functionality.
Note di rilascio
- Upgraded the MLPivotsBreakouts library version to 3 for enhanced prediction accuracy.
- Refined the label drawing function to ensure clearer visual representation of pivot points on the chart.
- Adjusted the plotting of breakout zones for more precise identification of bullish and bearish signals.
Script open-source
In pieno spirito TradingView, il creatore di questo script lo ha reso open-source, in modo che i trader possano esaminarlo e verificarne la funzionalità. Complimenti all'autore! Sebbene sia possibile utilizzarlo gratuitamente, ricorda che la ripubblicazione del codice è soggetta al nostro Regolamento.
Declinazione di responsabilità
Le informazioni ed i contenuti pubblicati non costituiscono in alcun modo una sollecitazione ad investire o ad operare nei mercati finanziari. Non sono inoltre fornite o supportate da TradingView. Maggiori dettagli nelle Condizioni d'uso.