OPEN-SOURCE SCRIPT
Cycle Channel Oscillator [LazyBear]
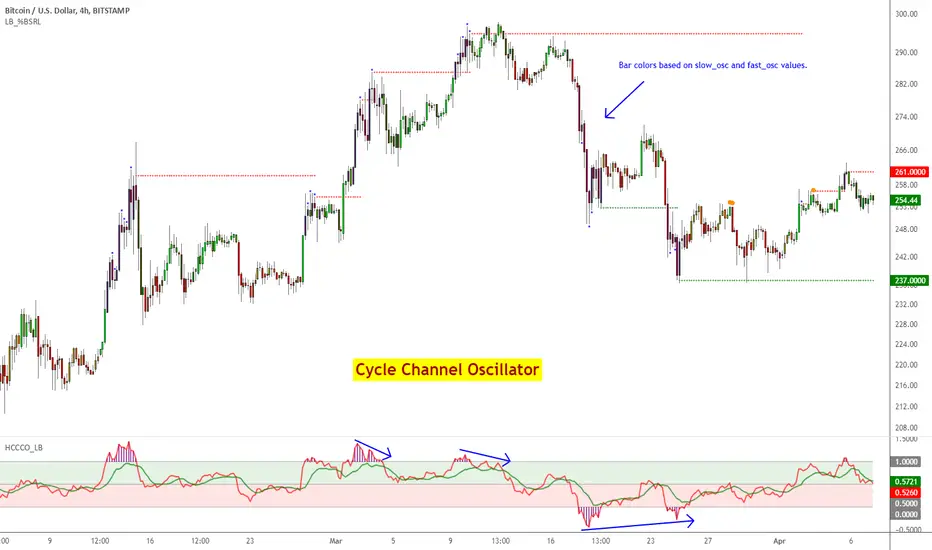
Here's an oscillator derived from my previous script, Cycle Channel Clone (tradingview.com/v/QmgtSIj5/).
There are 2 oscillator plots - fast & slow. Fast plot shows the price location with in the medium term channel, while slow plot shows the location of short term midline of cycle channel with respect to medium term channel.
Usage of this is similar to %b oscillator. The slow plot can be considered as the signal line.
Bar colors can be enabled via options page. When short plot is above 1.0 or below 0, they are marked purple (both histo and the bar color) to highlight the extreme condition.
This makes use of the default 10/30 values of Cycle Channel, but may need tuning for your instrument.
More info:
tradingview.com/v/QmgtSIj5/
List of my free indicators: bit.ly/1LQaPK8
List of my app-store indicators: blog.tradingview.com/?p=970 (More info: bit.ly/lazybeardoc)
Script open-source
In pieno spirito TradingView, il creatore di questo script lo ha reso open-source, in modo che i trader possano esaminarlo e verificarne la funzionalità. Complimenti all'autore! Sebbene sia possibile utilizzarlo gratuitamente, ricorda che la ripubblicazione del codice è soggetta al nostro Regolamento.
List of my free indicators: bit.ly/1LQaPK8
List of my indicators at Appstore: blog.tradingview.com/?p=970
List of my indicators at Appstore: blog.tradingview.com/?p=970
Declinazione di responsabilità
Le informazioni ed i contenuti pubblicati non costituiscono in alcun modo una sollecitazione ad investire o ad operare nei mercati finanziari. Non sono inoltre fornite o supportate da TradingView. Maggiori dettagli nelle Condizioni d'uso.