OPEN-SOURCE SCRIPT
Order Block Detection By Zia (StockWiz)
What is an Order Block?
An order block is a concept used in technical analysis, particularly in price action trading and supply and demand analysis. It refers to a significant area on a price chart where institutional traders, such as banks and hedge funds, have placed large orders. These blocks of orders often create strong support or resistance levels, as they represent areas where the "smart money" has shown interest in buying or selling an asset.
Characteristics of Order Blocks:
1. High Volume: Order blocks are typically associated with high trading volume, indicating strong participation from large players in the market.
2. Price Rejection: They often lead to sharp reversals or consolidations in price, as the large orders absorb the market's liquidity and push the price in the opposite direction.
3. Formation: Order blocks are usually formed after significant price movements, such as strong bullish or bearish trends, and can be identified by clusters of candles with long wicks or significant body sizes.
4. Support and Resistance: Once identified, order blocks can serve as potential support or resistance levels in future price movements. Prices often return to these areas, where new orders can be executed.
Identifying Order Blocks:
To identify order blocks, traders look for specific patterns and price actions on the chart. Here is a step-by-step guide to finding order blocks:
1. Identify a Strong Move: Look for strong bullish or bearish moves, which are often the result of large institutional orders.
2. Find Consolidation : After the strong move, find areas where the price consolidates. This is where large orders were likely placed.
3. Look for Rejections: Identify areas where the price has been rejected multiple times, creating a clear support or resistance zone.
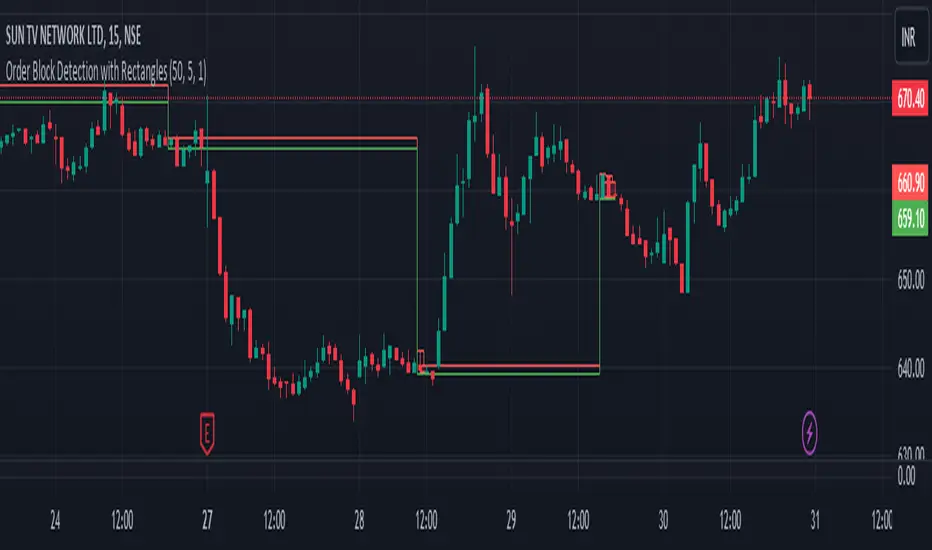
4. Mark the Order Block: Draw a rectangle around the consolidation area to mark the order block on your chart.
Student of Parag Mehta (StockWiz)
With Regards
Zia Rahim
An order block is a concept used in technical analysis, particularly in price action trading and supply and demand analysis. It refers to a significant area on a price chart where institutional traders, such as banks and hedge funds, have placed large orders. These blocks of orders often create strong support or resistance levels, as they represent areas where the "smart money" has shown interest in buying or selling an asset.
Characteristics of Order Blocks:
1. High Volume: Order blocks are typically associated with high trading volume, indicating strong participation from large players in the market.
2. Price Rejection: They often lead to sharp reversals or consolidations in price, as the large orders absorb the market's liquidity and push the price in the opposite direction.
3. Formation: Order blocks are usually formed after significant price movements, such as strong bullish or bearish trends, and can be identified by clusters of candles with long wicks or significant body sizes.
4. Support and Resistance: Once identified, order blocks can serve as potential support or resistance levels in future price movements. Prices often return to these areas, where new orders can be executed.
Identifying Order Blocks:
To identify order blocks, traders look for specific patterns and price actions on the chart. Here is a step-by-step guide to finding order blocks:
1. Identify a Strong Move: Look for strong bullish or bearish moves, which are often the result of large institutional orders.
2. Find Consolidation : After the strong move, find areas where the price consolidates. This is where large orders were likely placed.
3. Look for Rejections: Identify areas where the price has been rejected multiple times, creating a clear support or resistance zone.
4. Mark the Order Block: Draw a rectangle around the consolidation area to mark the order block on your chart.
Student of Parag Mehta (StockWiz)
With Regards
Zia Rahim
Script open-source
Nello spirito di TradingView, l'autore di questo script lo ha reso open source, in modo che i trader possano esaminarne e verificarne la funzionalità. Complimenti all'autore! Sebbene sia possibile utilizzarlo gratuitamente, ricordiamo che la ripubblicazione del codice è soggetta al nostro Regolamento.
Declinazione di responsabilità
Le informazioni e le pubblicazioni non sono intese come, e non costituiscono, consulenza o raccomandazioni finanziarie, di investimento, di trading o di altro tipo fornite o approvate da TradingView. Per ulteriori informazioni, consultare i Termini di utilizzo.