OPEN-SOURCE SCRIPT
IU Pivot Zones + GMA
DESCRIPTION:
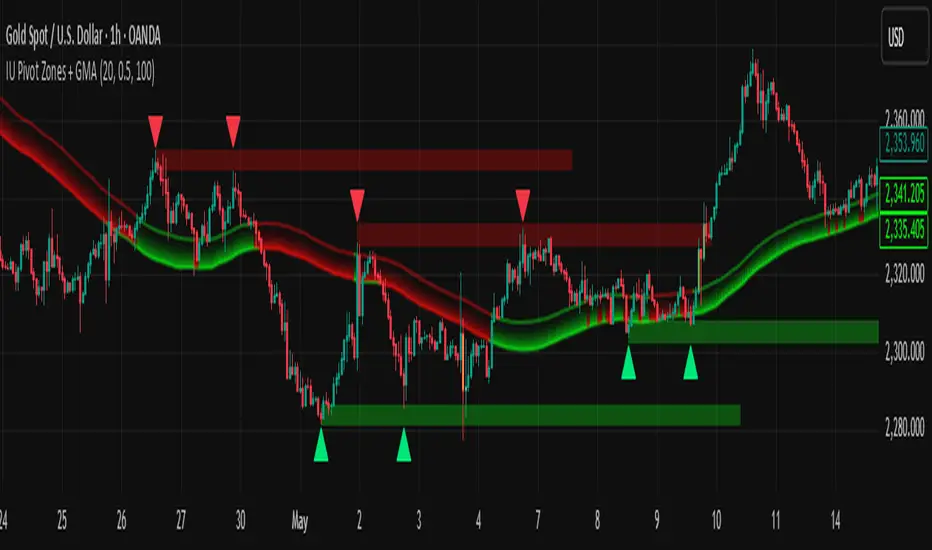
IU Pivot Zones + GMA is a smart price-action-based indicator that detects meaningful support and resistance zones formed through pivot highs/lows while combining them with dynamic zone generation and Geometric Moving Averages (GMA). This tool is built to help traders visualize institutional breakout/rejection zones with clear, logical mapping and live box management — helping you stay ahead of the move.
The indicator is designed for intraday, swing, and positional traders who want to enhance their trading decisions with visual confluence zones and market structure logic.
USER INPUTS
* Pivot point Lengths: Number of bars used to detect pivot highs/lows
* Zone length: Controls the thickness of the support/resistance zone; higher values create wider zones
* GMA Length: Period for calculating the geometric moving averages based on highs and lows
* Allow Bar/candle Color: Enables or disables special candle coloring when price interacts with the zones
LOGIC OF THE INDICATOR:
* Detects pivot highs and pivot lows using the user-defined length
* Compares consecutive pivot levels to determine if they fall within a valid ATR-based price band to form a zone
* If confirmed, the indicator dynamically plots a resistance or support box between those pivot points, colored respectively (red for resistance, green for support)
* The boxes update in real-time based on price action. If price respects the zone, the box extends forward. If price breaks the zone, the box disappears
* Geometric Moving Averages (GMA) based on logarithmic mean of highs and lows are plotted to offer a trend bias
* Candles that touch the top of the support zone are colored yellow, and those touching the bottom of the resistance zone are orange, enhancing zone reaction visibility
WHY IT IS UNIQUE:
* Uses logarithmic-based GMAs, which are smoother and less reactive than traditional moving averages
* ATR-based zone logic makes it adaptive to volatility instead of using fixed-width zones
* Combines structural levels (pivots), volatility filters (ATR), and trend overlays (GMA) in one unified tool
* Real-time zone extension and disappearance logic based on price interaction
HOW USER CAN BENEFIT FROM IT:
* Spot high-probability breakout or reversal zones that price respects consistently
* Use the GMA cloud for trend confirmation — for example, bullish bias when price is above both GMAs
* Build price action strategies around zone touches, breakouts, or rejections
* Use color-coded candles as real-time alerts for potential entry/exit signals near S/R levels
* Save time by avoiding manual marking of zones on charts across timeframes
DISCLAIMER:
This indicator is created for educational and informational purposes only. It does not constitute financial advice or a recommendation to buy or sell any asset. All trading involves risk, and users should conduct their own analysis or consult with a qualified financial advisor before making any trading decisions. The creator is not responsible for any losses incurred through the use of this tool. Use at your own discretion.
Script open-source
Nello spirito di TradingView, l'autore di questo script lo ha reso open source, in modo che i trader possano esaminarne e verificarne la funzionalità. Complimenti all'autore! Sebbene sia possibile utilizzarlo gratuitamente, ricordiamo che la ripubblicazione del codice è soggetta al nostro Regolamento.
Shivam mandai
Declinazione di responsabilità
Le informazioni e le pubblicazioni non sono intese come, e non costituiscono, consulenza o raccomandazioni finanziarie, di investimento, di trading o di altro tipo fornite o approvate da TradingView. Per ulteriori informazioni, consultare i Termini di utilizzo.