PROTECTED SOURCE SCRIPT
GTI B
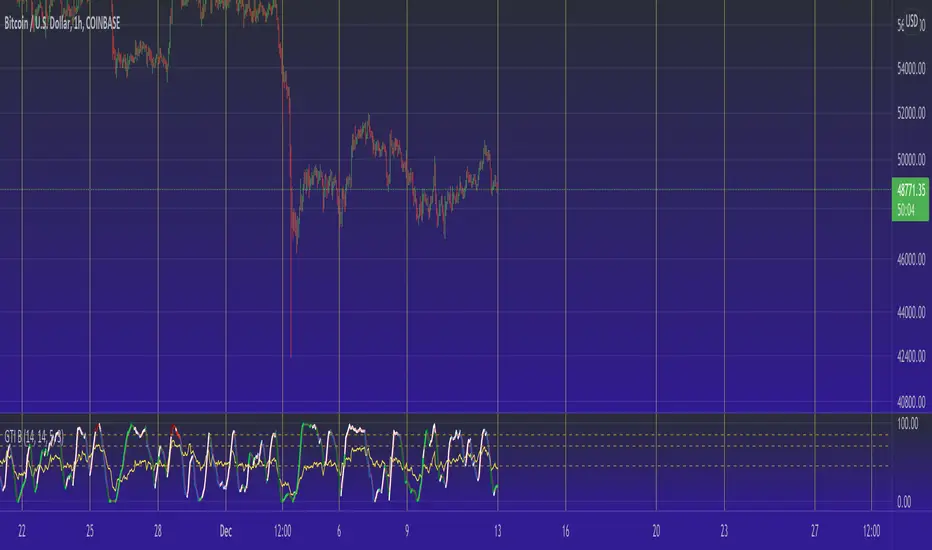
This indicator is a slightly modified, and slightly beefed-up, Stochastic RSI.
The standard Stochastic RSI is great for visualizing momentum swings, but does little to inform about transitions between larger trends that may require several Stochastic oscillations to play out. This makes Stochastic indicators difficult to use on their own, particularly outside of swing trading. Thankfully, as an oscillator itself, the standard RSI has cycles that occur more gradually. Because of this, it is possible to use Stochastic oscillations to decipher the short term swings of price action while using the standard RSI to help determine when there are likely to be reversals of larger trends. When used properly, this approach allows an investor to enter or exit positions at local highs or lows, while also improving the odds of executing at the start of new trends.
Aside from plotting both indicators in the same panel, this script also applies a useful color scheme to assist in determining good entry and exit points. The color of the Stochastic line is dependent on combinations of the current value of the line, whether or not it is above the trigger line, and also the current RSI value. The default colors of the Stochastic line is white when it is above the trigger line, and dark blue when it is below, making it easy to identify crosses. When RSI is oversold, the line will be colored by shades of green. When the Stochastic line crosses over the trigger line at these low RSI levels, the color flips from dark to light green. If RSI and Stochastic lines are all high, cross-under events will have the color change from dark red to red.
The strategy behind the color is as follows:
- Entries for longs or exits for shorts are best when RSI is oversold, so the line will be green at this point. Look for crossovers of the Stochastic lines when the are low (below 15) and looking like they will soon climb higher.
- Exits for longs or entries for shorts follow the same logic, but at high levels rather than low. Look for the Stochastic line to be red, and above a value of 85.
*Note* - Do some back-testing with this indicator to get a good feel for how it works. Due diligence is to observe it in bear, bull, and sideways trends, as they all produce unique outputs. Thankfully, the variations in behavior show some clear patterns through this indicator, adding to its ability to identify larger trends. For example, during the types of sell-offs and liquidation events that are oh so common in crypto, even the standard RSI may need to go through several oscillations before "resetting" and identifying a true bottom. When this occurs, RSI will be weak so the stochastic line will be green for much longer as it oscillates. A Stochastic line that reaches high levels but remains green is a good way to tell that another drop is coming, especially when this occurs on time frames in the several hours range. This is clearly useful during those trying times.
As another note, strong trends will require the use of divergence with the Stochastic oscillations to enter or exit positions at the best time. Strong trends will have the oscillator top or bottom out multiple times, so waiting for the oversold or overbought conditions to produce divergences will offer improved odds.
All in all, this indicator makes some useful combinations of two of the most popular market calculations around, and displays the information in a very user-friendly manner. It is powerful enough identify trends on short or long time frames, and concise enough to do so quickly and reliably.
Thank you for taking the time to read, and happy investing.
<deleted>
Script protetto
Questo script è pubblicato come codice protetto. Tuttavia, è possibile utilizzarle liberamente e senza alcuna limitazione – ulteriori informazioni qui.
Declinazione di responsabilità
Le informazioni e le pubblicazioni non sono intese come, e non costituiscono, consulenza o raccomandazioni finanziarie, di investimento, di trading o di altro tipo fornite o approvate da TradingView. Per ulteriori informazioni, consultare i Termini di utilizzo.