PROTECTED SOURCE SCRIPT
Color Vario Moving Average Ribbon
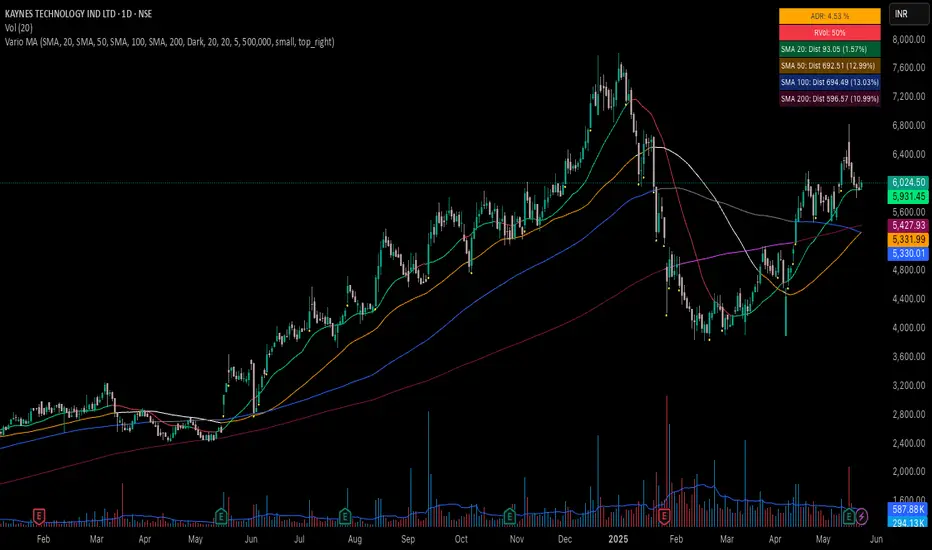
Color Vario Moving Average Ribbon – Smart Trend & Momentum Tool for Traders
The Color Vario Moving Average Ribbon is a powerful and customizable indicator that combines trend analysis, momentum detection, and volume confirmation — all in one clean and intuitive design.
🔍 Key Features:
✅ Dynamic Moving Averages (Up to 4)
• Choose from SMA, EMA, WMA, VWMA, or SMMA.
• Each MA line changes color based on price position (above = bullish, below = bearish).
• Great for spotting trend direction and momentum shifts at a glance.
📏 Distance from MAs (Table Display)
• Real-time display of how far price is from each MA (in % and points).
• Helps you assess extension, pullback depth, or reversion potential quickly.
📈 ADR% (Average Daily Range)
• Calculates average volatility using high-low ranges.
• Useful for setting realistic targets, stops, and risk assessments.
🔊 RVol (Relative Volume)
• Compares current volume to the average of recent days.
• Highlights whether volume is above or below normal (green = strong, red = weak).
• Perfect for volume confirmation during entries or breakouts.
⚡ Yellow Dot Signal (Momentum Spike)
• Appears when:
• Price moves more than a custom % from the previous candle.
• Volume is higher than your defined minimum.
• A visual cue for strong price + volume moves, helping you catch momentum trades early.
🎨 UI Customization
• Light/Dark mode compatibility.
• Adjust table size and position for your layout preference.
⸻
🚀 Who Should Use This?
This indicator is ideal for:
• Swing Traders looking for clean trend signals
• Intraday Traders who rely on momentum and volume
• Positional Traders tracking price behavior around key MAs
⸻
📌 Final Words
The Color Vario MA Ribbon is more than just a ribbon — it’s a compact trend, momentum, and volume dashboard built for traders who need clarity and precision.
Whether you’re looking for cleaner entries, stronger confirmations, or smarter exits, this tool adds serious edge to your trading chart.
💬 Don’t forget to give your feedback in the comments!
Script protetto
Questo script è pubblicato come codice protetto. Tuttavia, è possibile utilizzarle liberamente e senza alcuna limitazione – ulteriori informazioni qui.
Declinazione di responsabilità
Le informazioni e le pubblicazioni non sono intese come, e non costituiscono, consulenza o raccomandazioni finanziarie, di investimento, di trading o di altro tipo fornite o approvate da TradingView. Per ulteriori informazioni, consultare i Termini di utilizzo.