OPEN-SOURCE SCRIPT
VWAP Volume Profile [BigBeluga]

🔵 OVERVIEW
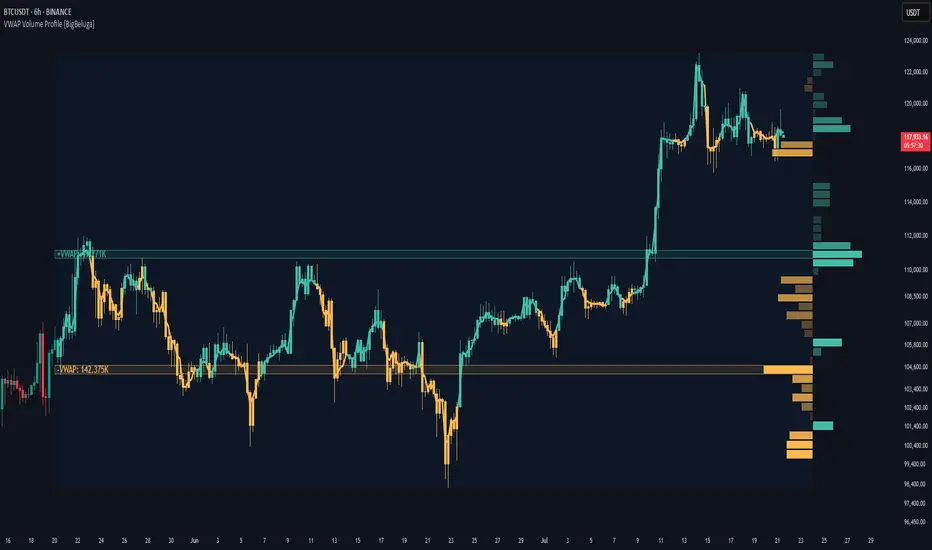
VWAP Volume Profile [BigBeluga] is an advanced hybrid of the VWAP and volume profile concepts. It visualizes how volume accumulates relative to VWAP movement—separating rising (+VWAP) and declining (−VWAP) activity into two mirrored horizontal profiles. It highlights the dominant price bins (POCs) where volume peaked during each directional phase, helping traders spot hidden accumulation or distribution zones.
🔵 CONCEPTS
🔵 FEATURES
🔵 HOW TO USE
🔵 CONCLUSION
VWAP Volume Profile [BigBeluga] merges two essential concepts—volume and VWAP—into a single, high-precision tool. By visualizing how volume behaves in relation to VWAP movement, it uncovers hidden dynamics often missed by traditional profiles. Perfect for intraday and swing traders who want a more nuanced read on market structure, trend strength, and volume flow.
VWAP Volume Profile [BigBeluga] is an advanced hybrid of the VWAP and volume profile concepts. It visualizes how volume accumulates relative to VWAP movement—separating rising (+VWAP) and declining (−VWAP) activity into two mirrored horizontal profiles. It highlights the dominant price bins (POCs) where volume peaked during each directional phase, helping traders spot hidden accumulation or distribution zones.
🔵 CONCEPTS
- VWAP-Driven Profiling: Unlike standard volume profiles, this tool segments volume based on VWAP movement—accumulating positive or negative volume depending on VWAP slope.
- Dual-Sided Profiles: Profiles expand horizontally to the right of price. Separate bins show rising (+) and falling (−) VWAP volume.
- Bin Logic: Volume is accumulated into defined horizontal bins based on VWAP’s position relative to price ranges.
- Gradient Coloring: Volume bars are colored with a dynamic gradient to emphasize intensity and direction.
- POC Highlighting: The highest-volume bin in each profile type (+/-) is marked with a transparent box and label.
- Contextual VWAP Line: VWAP is plotted and dynamically colored (green = rising, orange = falling) for instant trend context.
- Candle Overlay: Price candles are recolored to match the VWAP slope for full visual integration.
🔵 FEATURES
- Dual-sided horizontal volume profiles based on VWAP slope.
- Supports rising VWAP [+], falling VWAP [−], or both simultaneously.
- Customizable number of bins and lookback period.
- Dynamically colored VWAP line to show rising/falling bias.
- POC detection and labeling with volume values for +VWAP and −VWAP.
- Candlesticks are recolored to match VWAP bias for intuitive momentum tracking.
- Optional background boxes with customizable styling.
- Adaptive volume scaling to normalize bar length across markets.
🔵 HOW TO USE
- Use POC zones to identify high-volume consolidation areas and potential support/resistance levels.
- Watch for shifts in VWAP direction and observe how volume builds differently during uptrends and downtrends.
- Use the gradient profile shape to detect accumulation (widening volume below price) or distribution (above price).
- Use candle coloring for real-time confirmation of VWAP bias.
- Adjust the profile period or bin count to fit your trading style (e.g., intraday scalping or swing trading).
🔵 CONCLUSION
VWAP Volume Profile [BigBeluga] merges two essential concepts—volume and VWAP—into a single, high-precision tool. By visualizing how volume behaves in relation to VWAP movement, it uncovers hidden dynamics often missed by traditional profiles. Perfect for intraday and swing traders who want a more nuanced read on market structure, trend strength, and volume flow.
Script open-source
Nello spirito di TradingView, l'autore di questo script lo ha reso open source, in modo che i trader possano esaminarne e verificarne la funzionalità. Complimenti all'autore! Sebbene sia possibile utilizzarlo gratuitamente, ricordiamo che la ripubblicazione del codice è soggetta al nostro Regolamento.
🔵Gain access to our powerful tools : bigbeluga.com/tv
🔵Join our free discord for updates : bigbeluga.com/discord
All scripts & content provided by BigBeluga are for informational & educational purposes only.
🔵Join our free discord for updates : bigbeluga.com/discord
All scripts & content provided by BigBeluga are for informational & educational purposes only.
Declinazione di responsabilità
Le informazioni e le pubblicazioni non sono intese come, e non costituiscono, consulenza o raccomandazioni finanziarie, di investimento, di trading o di altro tipo fornite o approvate da TradingView. Per ulteriori informazioni, consultare i Termini di utilizzo.