OPEN-SOURCE SCRIPT
Distribution_Accumulation_ChurningDay_StockUnderStress
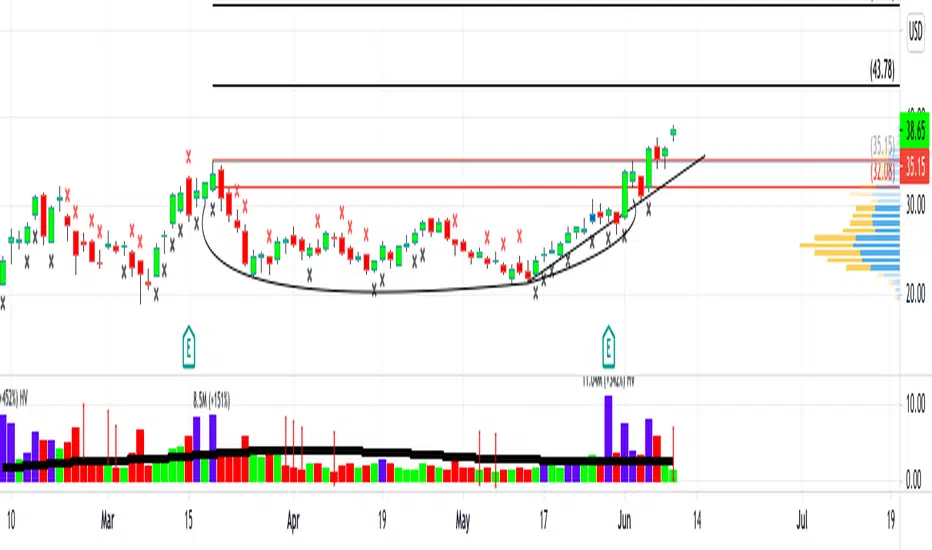
Distribution days is a term related to distribution stock in the sense that heavy institutional selling of shares is taking place. A distribution day, technically speaking, occurs when major market indexes fall 0.2% or more on volume that is higher than the previous trading day.
A follow-through day occurs during a market correction when a major index closes 1% or higher than the previous day, and in greater volume.
Churning day occurs when there is little price progress despite strong volume. It indicates a stock under stress.
You can use the script below in TradingView to plot these on the chart
RED CROSS on top of the bar - High volume Red (Distribution)
Black CROSS on bottom of bar - High Volume Green day (Accumulation/ Follow through)
Blue Bar with Black Cross. - High Volume green day but closed 55% below the day days range. (Churning action)
Blue Bar - Stock had a green day but closed in lower bounds(55% below the day days range) i.e under stress
Script open-source
Nello spirito di TradingView, l'autore di questo script lo ha reso open source, in modo che i trader possano esaminarne e verificarne la funzionalità. Complimenti all'autore! Sebbene sia possibile utilizzarlo gratuitamente, ricordiamo che la ripubblicazione del codice è soggetta al nostro Regolamento.
Declinazione di responsabilità
Le informazioni e le pubblicazioni non sono intese come, e non costituiscono, consulenza o raccomandazioni finanziarie, di investimento, di trading o di altro tipo fornite o approvate da TradingView. Per ulteriori informazioni, consultare i Termini di utilizzo.