OPEN-SOURCE SCRIPT
Volatility Switch Indicator [LazyBear]
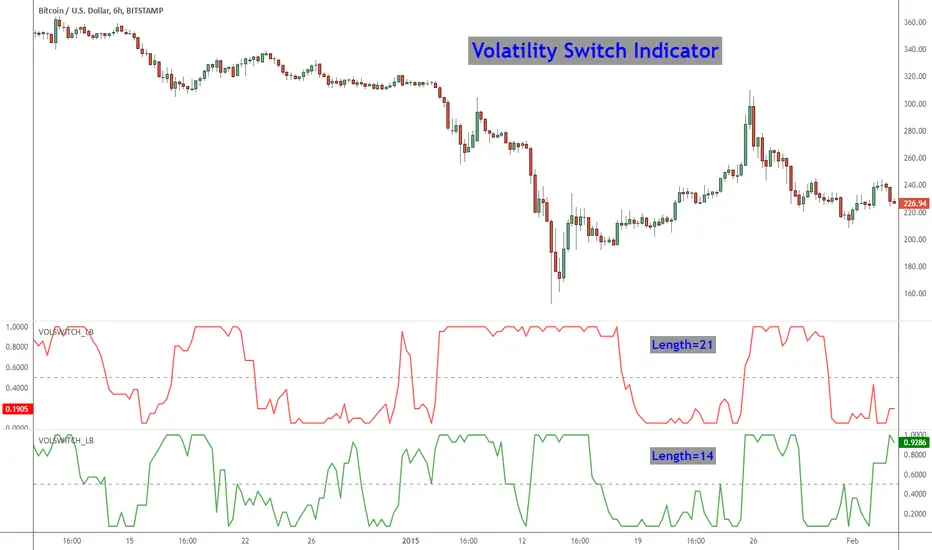
The Volatility Switch (VOLSWITCH) indicator, by Ron McEwan, estimates current volatility in respect to historical data, thus indicating whether the market is trending or in mean reversion mode. Range is normalized to 0 - 1.
When Volatility Switch rises above the 0.5 level, volatility in the market is increasing, thus the price action can be expected to become choppier with abrupt moves. When the indicator falls below the 0.5 level from recent high readings, volatility decreases, which may be considered a sign of trend formation.
Trading strategy as suggested by Ron McEwan is:
- If VOLSWITCH is less than 0.5, volatility decreases, which may be considered a sign of trend formation
- If VOLSWITCH is greater than 0.5, market is in high volatility mode. Can be choppy. Use RSI to look for OB/OS levels.
I have implemented support for 2 lengths (14 and 21) Note that, Pine doesn't support loops. Once it is introduced, I will publish an updated version.
Building a strategy out of this is straightforward (refer to my strategy explanation above), I strongly encourage new Pinescript coders to try to a plotarrow() based overlay indicator to get more familiar with Pine.
More info:
---------
The Volatility (Regime) Switch Indicator [S&C Feb 2013]: traders.com/Documentation/FEEDbk_docs/2013/02/McEwan.html
Complete list of my indicators:
-------------------------------------
docs.google.com/document/d/15AGCufJZ8CIUvwFJ9W-IKns88gkWOKBCvByMEvm5MLo/edit?usp=sharing
Script open-source
In pieno spirito TradingView, il creatore di questo script lo ha reso open-source, in modo che i trader possano esaminarlo e verificarne la funzionalità. Complimenti all'autore! Sebbene sia possibile utilizzarlo gratuitamente, ricorda che la ripubblicazione del codice è soggetta al nostro Regolamento.
List of my free indicators: bit.ly/1LQaPK8
List of my indicators at Appstore: blog.tradingview.com/?p=970
List of my indicators at Appstore: blog.tradingview.com/?p=970
Pubblicazioni correlate
Declinazione di responsabilità
Le informazioni ed i contenuti pubblicati non costituiscono in alcun modo una sollecitazione ad investire o ad operare nei mercati finanziari. Non sono inoltre fornite o supportate da TradingView. Maggiori dettagli nelle Condizioni d'uso.