OPEN-SOURCE SCRIPT
BETA (against any benchmark index - defaulted to NSE:NIFTY)
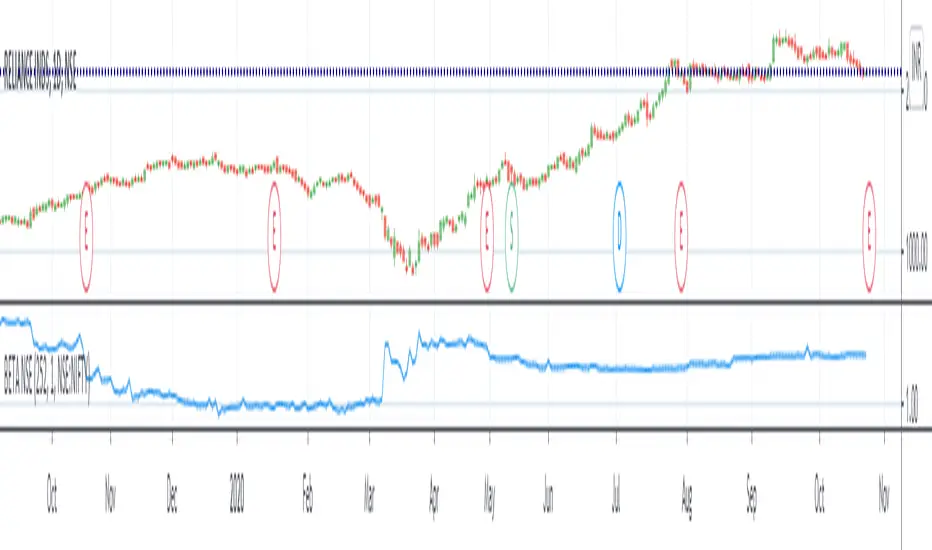
Beta value of a stock relative to benchmark index. Thanks to Ricardo Santos for the original script. This script is adapted from it.
To understand beta, refer Investopedia link: investopedia.com/terms/b/beta.asp
A beta value of 1 means the stock is directly correlated to benchmark index - volatility would be same as overall market.
Beta value less than 1 and greater than 0 means the stock is less volatile than the market.
Beta value more than 1 would mean the stock is more volatile than the market.
A beta value of 1.2 would roughly translate to the stock being 20% more volatile than the overall market.
A negative beta value indicates the stock is inversely correlated to market.
In the example chart, you can see the Beta value change in NSE:RELIANCE with respect to NSE:NIFTY.
Script open-source
Nello spirito di TradingView, l'autore di questo script lo ha reso open source, in modo che i trader possano esaminarne e verificarne la funzionalità. Complimenti all'autore! Sebbene sia possibile utilizzarlo gratuitamente, ricordiamo che la ripubblicazione del codice è soggetta al nostro Regolamento.
Declinazione di responsabilità
Le informazioni e le pubblicazioni non sono intese come, e non costituiscono, consulenza o raccomandazioni finanziarie, di investimento, di trading o di altro tipo fornite o approvate da TradingView. Per ulteriori informazioni, consultare i Termini di utilizzo.