OPEN-SOURCE SCRIPT
2band
Hello traders
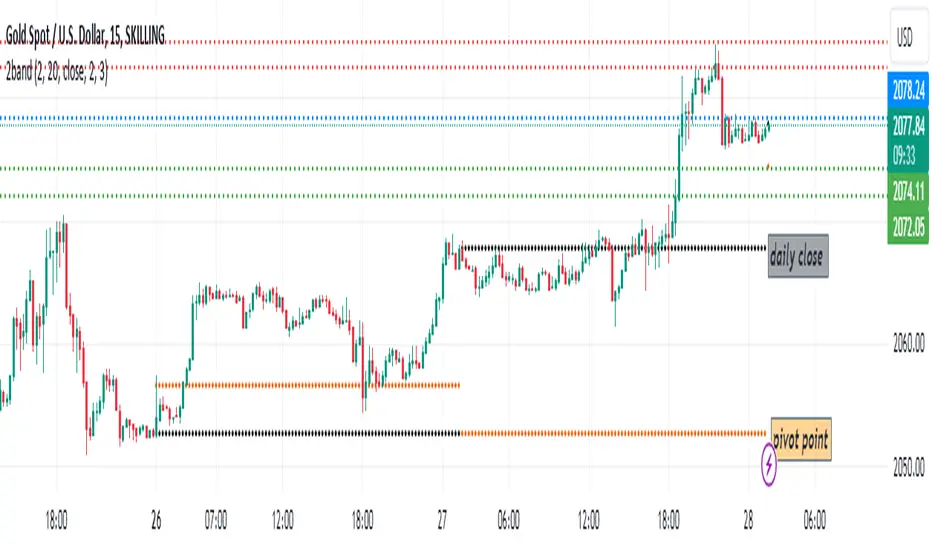
In this script, I have defined two bands with a deviation of 2 and 3
I designed the setup so that the upper lines represent red resistance, the lower lines represent green support, and the blue line represents the average price of the previous 20 candles in each time frame.
This code can be used mostly in time frames above 30 minutes and somehow predict possible price targets.
For example, if the price closes above the blue line in the one-hour time frame, the two fixed lines above are considered as targets and vice versa.
I have also added the pivot point calculation formula in orange
Most importantly, I added the closing price of the previous days in black
I hope it will be used by dear traders and you will support more for new works.
Script open-source
Nello spirito di TradingView, l'autore di questo script lo ha reso open source, in modo che i trader possano esaminarne e verificarne la funzionalità. Complimenti all'autore! Sebbene sia possibile utilizzarlo gratuitamente, ricordiamo che la ripubblicazione del codice è soggetta al nostro Regolamento.
Declinazione di responsabilità
Le informazioni e le pubblicazioni non sono intese come, e non costituiscono, consulenza o raccomandazioni finanziarie, di investimento, di trading o di altro tipo fornite o approvate da TradingView. Per ulteriori informazioni, consultare i Termini di utilizzo.