OPEN-SOURCE SCRIPT
Aggiornato [blackcat] L2 Barbara Star Supertrend Indicator
Level 2
Background
Barbara Star’s article on July 2023, “Stay On Track With The Supertrend Indicator”, I rewrote it as pine script for your information.
Function
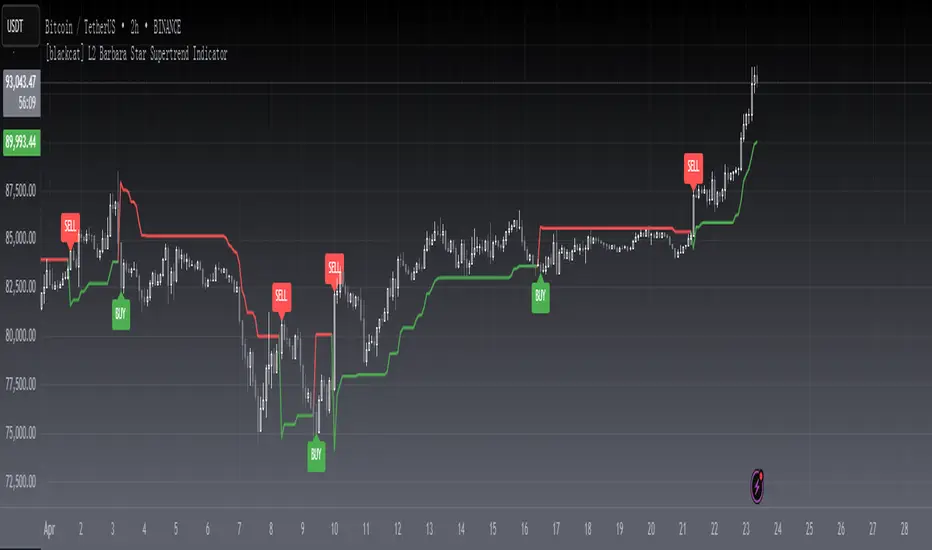
A supertrend indicator is displayed either above or below the closing price to signal a buy or sell. The indicator changes color depending on whether you should buy or not. When the Supertrend indicator falls below the closing price, the indicator turns green, signaling one or more entry points to buy.
Author Barbara Star describes the Supertrend indicator and how it can be used as a means for traders to stay in sync with the larger trend. She explains how J. Welles Wilder's Average True Range (ATR) forms a basis for supertrend calculations. ATR does not measure price direction, but rather provides a measure of volatility over a period of time. The Supertrend indicator, on the other hand, provides a more comprehensive view of trend direction. In addition, the indicator provides price levels at which a trend reversal would occur.
Green color stands for up trend;
Red color stands for down trend.
Remarks
Feedbacks are appreciated.
Background
Barbara Star’s article on July 2023, “Stay On Track With The Supertrend Indicator”, I rewrote it as pine script for your information.
Function
A supertrend indicator is displayed either above or below the closing price to signal a buy or sell. The indicator changes color depending on whether you should buy or not. When the Supertrend indicator falls below the closing price, the indicator turns green, signaling one or more entry points to buy.
Author Barbara Star describes the Supertrend indicator and how it can be used as a means for traders to stay in sync with the larger trend. She explains how J. Welles Wilder's Average True Range (ATR) forms a basis for supertrend calculations. ATR does not measure price direction, but rather provides a measure of volatility over a period of time. The Supertrend indicator, on the other hand, provides a more comprehensive view of trend direction. In addition, the indicator provides price levels at which a trend reversal would occur.
Green color stands for up trend;
Red color stands for down trend.
Remarks
Feedbacks are appreciated.
Note di rilascio
OVERVIEWThe [blackcat] L2 Barbara Star Supertrend Indicator is a powerful tool designed to help traders identify trend direction and potential entry/exit points using the Supertrend algorithm. This indicator calculates the Supertrend line based on Average True Range (ATR) and plots it on the chart, providing clear visual signals for buying and selling opportunities. With customizable parameters and alert conditions, it offers flexibility for various trading strategies 📈💹.
FEATURES
Calculates the Supertrend line based on ATR and a user-defined multiplier:
ATR Length: Period for calculating Average True Range.
Multiplier: Factor applied to ATR for determining band widths.
Plots the Supertrend line on the chart with dynamic coloring:
Green when the price is above the Supertrend line (bullish).
Red when the price is below the Supertrend line (bearish).
Displays buy ('BUY') and sell ('SELL') labels on the chart for quick identification 🏷️
Generates alerts based on crossover events between the price and Supertrend line 🔔
Supports customizable alert messages for personalized notifications 🛎️
HOW TO USE
Add the indicator to your TradingView chart by selecting it from the indicators list.
Adjust the ATR Length and Multiplier parameters to suit your preferred sensitivity ⚙️.
Monitor the chart for buy and sell labels indicating potential trade opportunities.
Set up alerts based on the generated signals to receive notifications when conditions are met 📲.
Use the Supertrend line as a reference for trend direction and potential reversal points.
LIMITATIONS
The indicator may generate false signals in highly volatile or ranging markets 🌪️.
Users should combine this indicator with other forms of analysis for more reliable trading decisions.
The effectiveness of the indicator may vary depending on the asset and timeframe being analyzed.
NOTES
Ensure that you have sufficient historical data available for accurate calculations.
Test the indicator thoroughly on demo accounts before applying it to live trading 🔍.
Customize the appearance and parameters as needed to fit your trading strategy.
Script open-source
Nello spirito di TradingView, l'autore di questo script lo ha reso open source, in modo che i trader possano esaminarne e verificarne la funzionalità. Complimenti all'autore! Sebbene sia possibile utilizzarlo gratuitamente, ricordiamo che la ripubblicazione del codice è soggetta al nostro Regolamento.
Avoid losing contact!Don't miss out! The first and most important thing to do is to join my Discord chat now! Click here to start your adventure: discord.com/invite/ZTGpQJq 防止失联,请立即行动,加入本猫聊天群: discord.com/invite/ZTGpQJq
Declinazione di responsabilità
Le informazioni e le pubblicazioni non sono intese come, e non costituiscono, consulenza o raccomandazioni finanziarie, di investimento, di trading o di altro tipo fornite o approvate da TradingView. Per ulteriori informazioni, consultare i Termini di utilizzo.