OPEN-SOURCE SCRIPT
Recent Swing High/Low Lines With Stats Table
Swing-Based Volatility
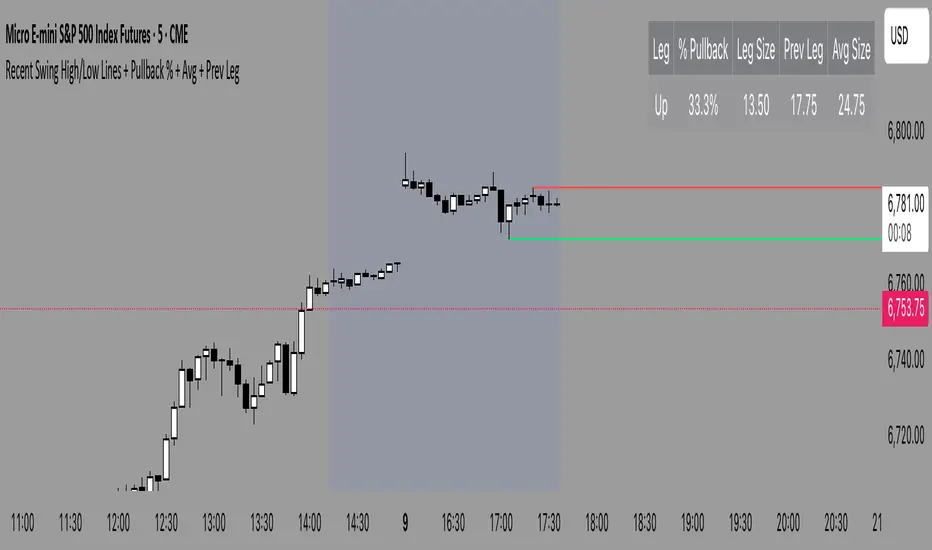
This indicator measures volatility using the distance between recent swing highs and swing lows rather than fixed averages like ATR. Each swing captures a meaningful shift in market control, making this a structure-aware view of volatility.
The tool calculates and plots the average swing range over time, highlighting when the market is expanding (wide swings, high volatility) or contracting (tight swings, low volatility). These phases can help traders identify breakout potential, adjust stop-loss or profit targets, and align position sizing with current market conditions.
Script open-source
In pieno spirito TradingView, il creatore di questo script lo ha reso open-source, in modo che i trader possano esaminarlo e verificarne la funzionalità. Complimenti all'autore! Sebbene sia possibile utilizzarlo gratuitamente, ricorda che la ripubblicazione del codice è soggetta al nostro Regolamento.
Declinazione di responsabilità
Le informazioni ed i contenuti pubblicati non costituiscono in alcun modo una sollecitazione ad investire o ad operare nei mercati finanziari. Non sono inoltre fornite o supportate da TradingView. Maggiori dettagli nelle Condizioni d'uso.