PROTECTED SOURCE SCRIPT
HTF 4 MA Trend Analysis by Prosum Solutions
Introduction
This indicator will render up to four (4) moving averages on the chart in any higher timeframe and provide a "MA Bullish/Bearish Strength Signal" as a plot output that can be used to link with other indicators on the chart that use the `input.source()` function.
How is it original and useful?
The indicator allows you to use up to four (4) different moving average types of various types, each at different lengths. The moving average types that are supported are:
This indicator makes use of the security() function and applies the best-practices as provided by the PineCoders' script called "`security()` revisited PineCoders" so that the indicator will not repaint when you refresh the chart or re-open it at a later date.
What does it do and how does it do it?
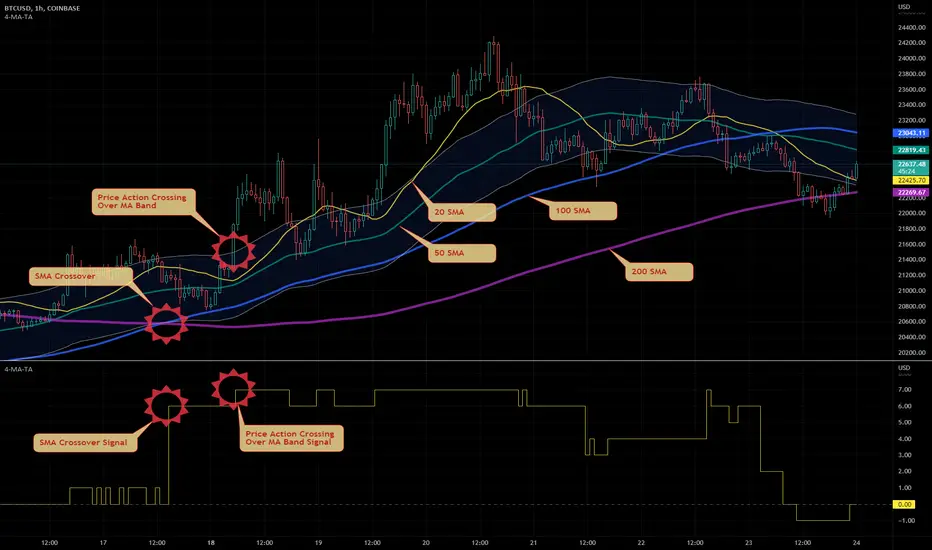
Using the four moving averages, each with increasing lengths, allows you to confirm bullish and bearish trends using a weighted rating system to compute a trend strength signal value. Specifically, the indicator provides a plot data series called "MA Bullish/Bullish Strength Signal" the is simply the summation of the bullish/bearish trend weight values between the four moving averages. The bullish/bearish trend weight values are determined by the position of the moving average lines relative to each other. For example, when Moving Average 1 is above Moving Average 2, this is considered a bullish trend and the weight value will be 1. The weight values can be changed to in the settings to define your own specific weights/values to rate the trend strength. The following list defines the meaning of the "MA Bullish/Bullish Strength Signal" value.
An additional option allows you to add a band around a specific moving average using a deviation percentage to further evaluate the candles being above or below the upper/lower bands. When the candle's close value is above or below the bands, you can add another weighted value to the signal result. As a result, an additional plot series called "MA Bull/Bear+Band Signal" is provided to include the moving average band weight.
Lastly, the chart example above demonstrates how you can use the indicator as an overlay to the price chart or as a separate panel above or below the price chart. The indicator can change what to plot based on an input setting called "Display Mode". When set to `Overlay`, the indicator will draw only the MA and MA Band plots. When set to `Pane`, the indicator will draw only the signal plots over a zero line to visualize the signal changes with the chart events.
Enjoy! 😊👍
This indicator will render up to four (4) moving averages on the chart in any higher timeframe and provide a "MA Bullish/Bearish Strength Signal" as a plot output that can be used to link with other indicators on the chart that use the `input.source()` function.
How is it original and useful?
The indicator allows you to use up to four (4) different moving average types of various types, each at different lengths. The moving average types that are supported are:
- SMA - Simple Moving Average
- EMA - Exponential Moving Average
- RMA - RSI Moving Average
- WMA - Weighted Moving Average
- VWMA - Volume-Weighted Moving Average
- SWMA - Symmetrically-Weighted Moving Average
This indicator makes use of the security() function and applies the best-practices as provided by the PineCoders' script called "`security()` revisited PineCoders" so that the indicator will not repaint when you refresh the chart or re-open it at a later date.
What does it do and how does it do it?
Using the four moving averages, each with increasing lengths, allows you to confirm bullish and bearish trends using a weighted rating system to compute a trend strength signal value. Specifically, the indicator provides a plot data series called "MA Bullish/Bullish Strength Signal" the is simply the summation of the bullish/bearish trend weight values between the four moving averages. The bullish/bearish trend weight values are determined by the position of the moving average lines relative to each other. For example, when Moving Average 1 is above Moving Average 2, this is considered a bullish trend and the weight value will be 1. The weight values can be changed to in the settings to define your own specific weights/values to rate the trend strength. The following list defines the meaning of the "MA Bullish/Bullish Strength Signal" value.
- -6 = Strong bearish
- -2 = Moderate bearish
- 2 = Moderate bullish
- 6 = Strong bullish
An additional option allows you to add a band around a specific moving average using a deviation percentage to further evaluate the candles being above or below the upper/lower bands. When the candle's close value is above or below the bands, you can add another weighted value to the signal result. As a result, an additional plot series called "MA Bull/Bear+Band Signal" is provided to include the moving average band weight.
Lastly, the chart example above demonstrates how you can use the indicator as an overlay to the price chart or as a separate panel above or below the price chart. The indicator can change what to plot based on an input setting called "Display Mode". When set to `Overlay`, the indicator will draw only the MA and MA Band plots. When set to `Pane`, the indicator will draw only the signal plots over a zero line to visualize the signal changes with the chart events.
Enjoy! 😊👍
Script protetto
Questo script è pubblicato come codice protetto. Tuttavia, è possibile utilizzarlo liberamente e senza alcuna limitazione – per saperne di più clicca qui.
Contact Us on our Website: prosum-solutions.store/contact-us/
Documentation for Indicators: prosum-solutions.store/documentation/
Discord Server: discord.com/invite/Zuf9MyKmfW
Documentation for Indicators: prosum-solutions.store/documentation/
Discord Server: discord.com/invite/Zuf9MyKmfW
Declinazione di responsabilità
Le informazioni ed i contenuti pubblicati non costituiscono in alcun modo una sollecitazione ad investire o ad operare nei mercati finanziari. Non sono inoltre fornite o supportate da TradingView. Maggiori dettagli nelle Condizioni d'uso.