OPEN-SOURCE SCRIPT
Aggiornato [blackcat] L2 Ehlers Fisher Transform of N-bar Price Channel
Level: 2
Background
John F. Ehlers introuced Fisher Transform of Normalize Price to a N-Day Channel in his "Cybernetic Analysis for Stocks and Futures" chapter 1 on 2004.
Function
The Fisher transform changes the PDF of any waveform so that the transformed output has an approximately Gaussian PDF. So what does this mean for trading? If the prices are normalized to fall within the range from −1 to +1 and subjected to the Fisher transform, extreme price movements are relatively rare events. This means the turning points can be clearly and unambiguously identified.
Key Signal
Fish ---> Fisher transform fast line
Fish[2] ---> Fisher transform slow line
Pros and Cons
100% John F. Ehlers definition translation of original work, even variable names are the same. This help readers who would like to use pine to read his book. If you had read his works, then you will be quite familiar with my code style.
Remarks
The 21th script for Blackcat1402 John F. Ehlers Week publication.
Readme
In real life, I am a prolific inventor. I have successfully applied for more than 60 international and regional patents in the past 12 years. But in the past two years or so, I have tried to transfer my creativity to the development of trading strategies. Tradingview is the ideal platform for me. I am selecting and contributing some of the hundreds of scripts to publish in Tradingview community. Welcome everyone to interact with me to discuss these interesting pine scripts.
The scripts posted are categorized into 5 levels according to my efforts or manhours put into these works.
Level 1 : interesting script snippets or distinctive improvement from classic indicators or strategy. Level 1 scripts can usually appear in more complex indicators as a function module or element.
Level 2 : composite indicator/strategy. By selecting or combining several independent or dependent functions or sub indicators in proper way, the composite script exhibits a resonance phenomenon which can filter out noise or fake trading signal to enhance trading confidence level.
Level 3 : comprehensive indicator/strategy. They are simple trading systems based on my strategies. They are commonly containing several or all of entry signal, close signal, stop loss, take profit, re-entry, risk management, and position sizing techniques. Even some interesting fundamental and mass psychological aspects are incorporated.
Level 4 : script snippets or functions that do not disclose source code. Interesting element that can reveal market laws and work as raw material for indicators and strategies. If you find Level 1~2 scripts are helpful, Level 4 is a private version that took me far more efforts to develop.
Level 5 : indicator/strategy that do not disclose source code. private version of Level 3 script with my accumulated script processing skills or a large number of custom functions. I had a private function library built in past two years. Level 5 scripts use many of them to achieve private trading strategy.
Note di rilascio
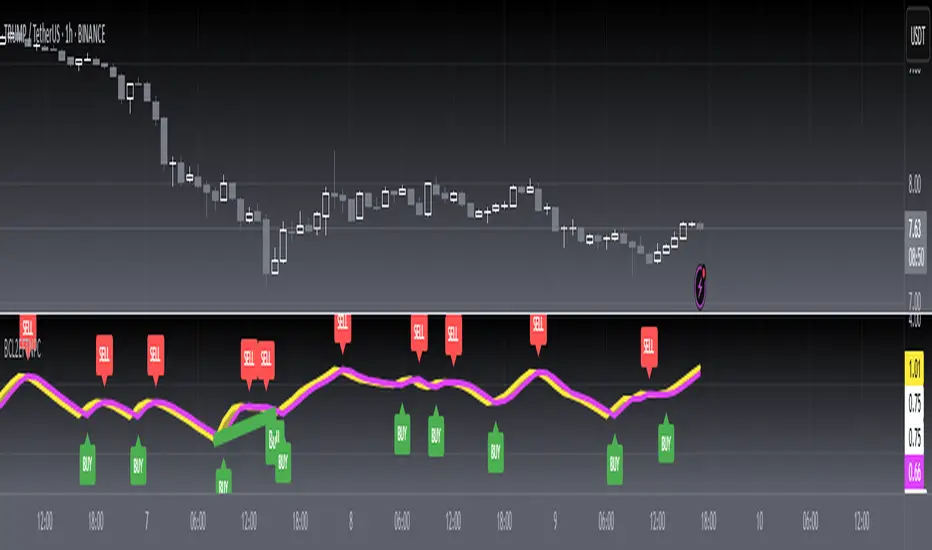
OVERVIEWThe [blackcat] L2 Ehlers Fisher Transform of N-bar Price Channel indicator applies the Fisher Transform to price channel data, generating trading signals through bullish and bearish divergences. It provides visual and alert-based signals for potential entry points.
FEATURES
• Fisher Transform calculation based on N-bar price channels
• Visual representation of Fisher values with trigger lines
• Bullish and bearish divergence detection
• Both regular and hidden divergence patterns
• Customizable lookback periods and plotting options
• Alert conditions for all divergence types
HOW TO USE
Select source price using the Source input
Adjust the N-bar Length to control channel width
Configure divergence settings:
Pivot Lookback Right/Left
Max/Min Lookback Range
Toggle visibility of bullish/bearish patterns
Monitor for crossover signals and divergence patterns
INPUT PARAMETERS
• Source: Price series to analyze (default: HL2)
• N-bar Length: Channel period length (default: 8)
• Pivot Lookback Right/Left: Divergence detection range
• Max/Min Lookback Range: Valid divergence timeframe
• Plot Bullish/Bearish: Enable/disable pattern visualization
• Plot Hidden Bullish/Bearish: Show/hide hidden patterns
LIMITATIONS
• Results depend heavily on input parameter selection
• Divergence patterns may not always precede price movements
• Requires confirmation from other indicators for reliable trading
NOTES
• Yellow line represents current Fisher value
• Fuchsia line shows previous Fisher value
• Labels appear at crossover points
• Color-coded alerts for different divergence types
Script open-source
Nello spirito di TradingView, l'autore di questo script lo ha reso open source, in modo che i trader possano esaminarne e verificarne la funzionalità. Complimenti all'autore! Sebbene sia possibile utilizzarlo gratuitamente, ricordiamo che la ripubblicazione del codice è soggetta al nostro Regolamento.
Avoid losing contact!Don't miss out! The first and most important thing to do is to join my Discord chat now! Click here to start your adventure: discord.com/invite/ZTGpQJq 防止失联,请立即行动,加入本猫聊天群: discord.com/invite/ZTGpQJq
Declinazione di responsabilità
Le informazioni e le pubblicazioni non sono intese come, e non costituiscono, consulenza o raccomandazioni finanziarie, di investimento, di trading o di altro tipo fornite o approvate da TradingView. Per ulteriori informazioni, consultare i Termini di utilizzo.