OPEN-SOURCE SCRIPT
Volume + Volatility
Before I begin I want to mention:
1. This is a variation of the 'CCI & BB' made by matsu_bitmex (Link: tradingview.com/script/IkciCgbh/) and SigmaDraconis's 'On Balance Volume Oscillator + Bollinger Bands' (Link: tradingview.com/script/0MbvTUui-On-Balance-Volume-Oscillator-Bollinger-Bands-SigmaDraconis/)
2. While using this sometimes you may not notice the crossover so I've added the Line 'x' outside 'x' BB to only see if Line 3 and 4 crossed over
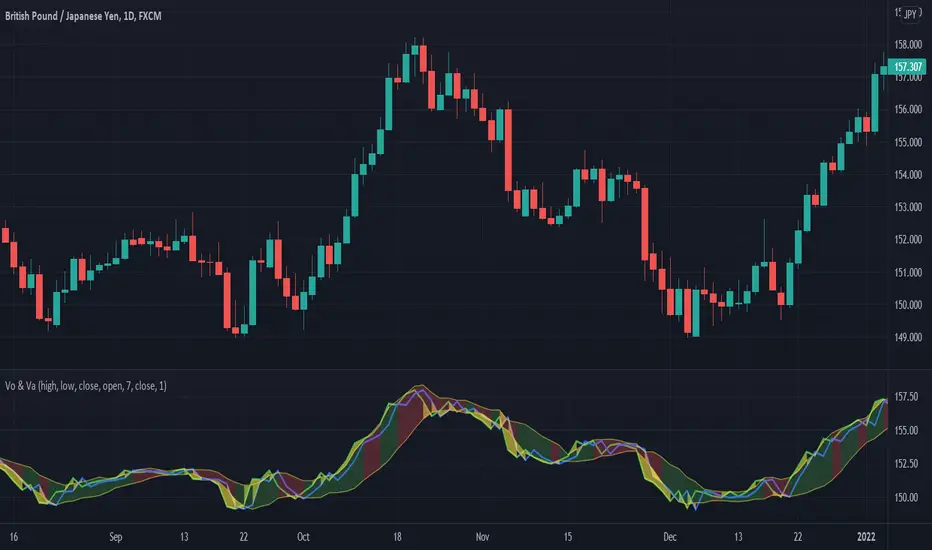
The indicator:
1. When the background is green and the 2 lines are going up it means uptrend
2. When the background is red and the 2 lines are going down it means downtrend
3. When there is a crossover and the background outside BB turns yellow, it means there is a lot of volatility or volume
How to use (Or how I use this):
1. All trades based on the yellow color MUST be during a trend
2. When the color changes to yellow for the 1st time in the direction of a trend it is advisable to enter
1. This is a variation of the 'CCI & BB' made by matsu_bitmex (Link: tradingview.com/script/IkciCgbh/) and SigmaDraconis's 'On Balance Volume Oscillator + Bollinger Bands' (Link: tradingview.com/script/0MbvTUui-On-Balance-Volume-Oscillator-Bollinger-Bands-SigmaDraconis/)
2. While using this sometimes you may not notice the crossover so I've added the Line 'x' outside 'x' BB to only see if Line 3 and 4 crossed over
The indicator:
1. When the background is green and the 2 lines are going up it means uptrend
2. When the background is red and the 2 lines are going down it means downtrend
3. When there is a crossover and the background outside BB turns yellow, it means there is a lot of volatility or volume
How to use (Or how I use this):
1. All trades based on the yellow color MUST be during a trend
2. When the color changes to yellow for the 1st time in the direction of a trend it is advisable to enter
Script open-source
In pieno spirito TradingView, il creatore di questo script lo ha reso open-source, in modo che i trader possano esaminarlo e verificarne la funzionalità. Complimenti all'autore! Sebbene sia possibile utilizzarlo gratuitamente, ricorda che la ripubblicazione del codice è soggetta al nostro Regolamento.
Declinazione di responsabilità
Le informazioni ed i contenuti pubblicati non costituiscono in alcun modo una sollecitazione ad investire o ad operare nei mercati finanziari. Non sono inoltre fornite o supportate da TradingView. Maggiori dettagli nelle Condizioni d'uso.