OPEN-SOURCE SCRIPT
Aggiornato Strong Tight Closes in Strong Uptrend
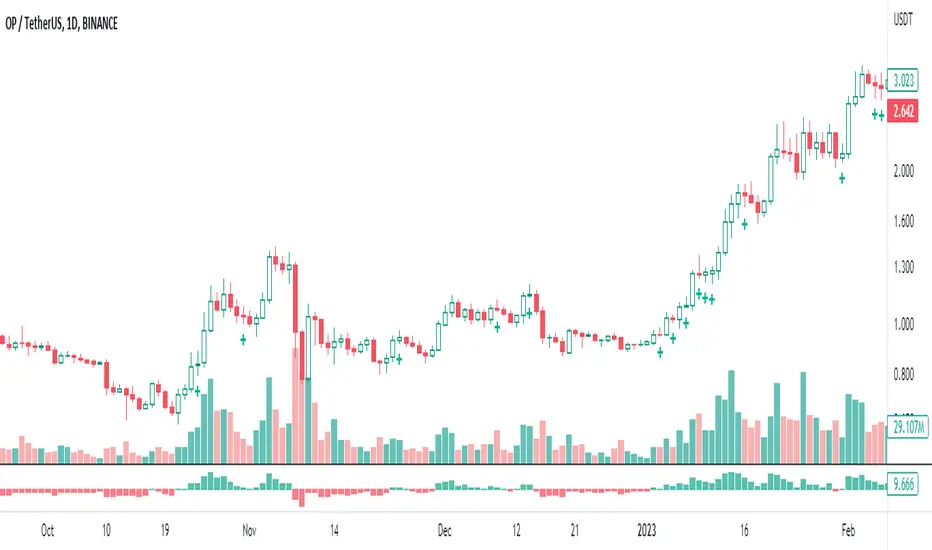
This indicator helps to visually identify "strong tight closes" in an uptrend. It serves to make it easier to spot not only tight but tight AND strong consolidations in an ongoing uptrend for a potential continuation entry. Please keep in mind the indicator counts with distance between Close values of 2 separate candles, that's why it's called "Tight Back to Back Candles". This doesn't identify "tight close" in a sense of very narrow range between Open and Close of a single candle, not any other volatility measures such as average true range etc.
Caution: This is not a complete strategy, it's only a visual tool for making potential continuation patterns easier to spot.
Conditions:
- Measure the difference between CLOSE values of two candles in percentages
- If the difference is lower than a certain threshold set by the user, (1.3% by default) plot a green cross below the latter candle
Filters:
- Low of both candles must be above 10EMA on the current timeframe
- Both Closes must be in the upper half of the candles' Low to High range
Note di rilascio
Now AT LEAST one of the candles must close in the UPPER 60% of its Low to High rangeNote di rilascio
- Default percentage threshold set to 2.0% as it suits better the higher timeframes such as Daily- Candle must CLOSE above 10EMA to pass the filter (previously it was set to LOW of the candle above 10EMA, that was more strict and didn't catch the beginning of trends when EMA is just curling up)
Note di rilascio
User can define whether the condition for price above 10EMA is LOW, HIGH, OPEN or CLOSEScript open-source
Nello spirito di TradingView, l'autore di questo script lo ha reso open source, in modo che i trader possano esaminarne e verificarne la funzionalità. Complimenti all'autore! Sebbene sia possibile utilizzarlo gratuitamente, ricordiamo che la ripubblicazione del codice è soggetta al nostro Regolamento.
Declinazione di responsabilità
Le informazioni e le pubblicazioni non sono intese come, e non costituiscono, consulenza o raccomandazioni finanziarie, di investimento, di trading o di altro tipo fornite o approvate da TradingView. Per ulteriori informazioni, consultare i Termini di utilizzo.
Script open-source
Nello spirito di TradingView, l'autore di questo script lo ha reso open source, in modo che i trader possano esaminarne e verificarne la funzionalità. Complimenti all'autore! Sebbene sia possibile utilizzarlo gratuitamente, ricordiamo che la ripubblicazione del codice è soggetta al nostro Regolamento.
Declinazione di responsabilità
Le informazioni e le pubblicazioni non sono intese come, e non costituiscono, consulenza o raccomandazioni finanziarie, di investimento, di trading o di altro tipo fornite o approvate da TradingView. Per ulteriori informazioni, consultare i Termini di utilizzo.