PROTECTED SOURCE SCRIPT
New Price Highs/Lows (plotted on RSI)
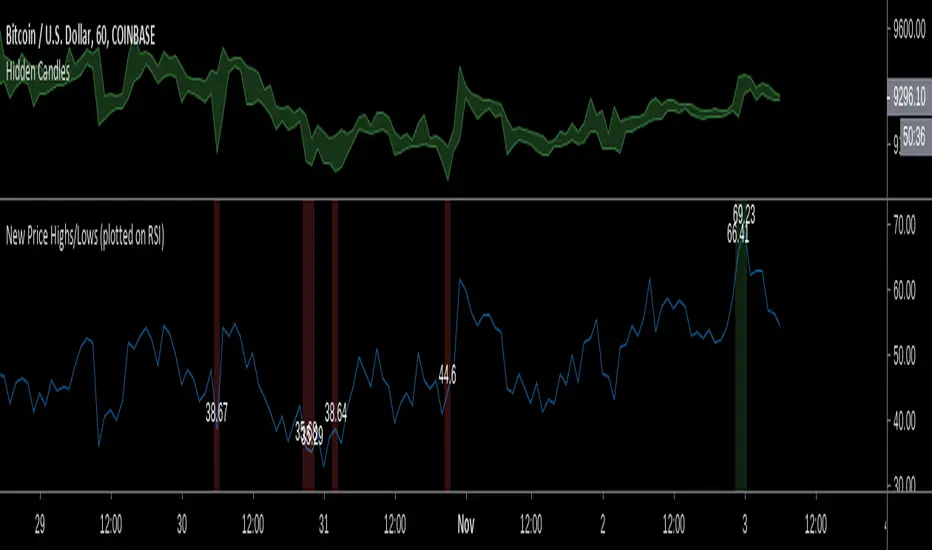
Rather than rely on existing indicators for bullish/bearish divergence, I'd rather just identify it myself.
This indicator just makes this easier to see (hands-free) the relevant data on the RSI at points where the price hits new highs/lows by colouring the background on the RSI based on price action and also plotting the RSI values at those points so you dont need to keep hovering over the RSI with your mouse.
Stay aware of your lookback setting because it will effect how often the new price highs/lows are highlighted.
Script protetto
Questo script è pubblicato come codice protetto. Tuttavia, è possibile utilizzarle liberamente e senza alcuna limitazione – ulteriori informazioni qui.
Declinazione di responsabilità
Le informazioni e le pubblicazioni non sono intese come, e non costituiscono, consulenza o raccomandazioni finanziarie, di investimento, di trading o di altro tipo fornite o approvate da TradingView. Per ulteriori informazioni, consultare i Termini di utilizzo.