OPEN-SOURCE SCRIPT
Trend Intensity
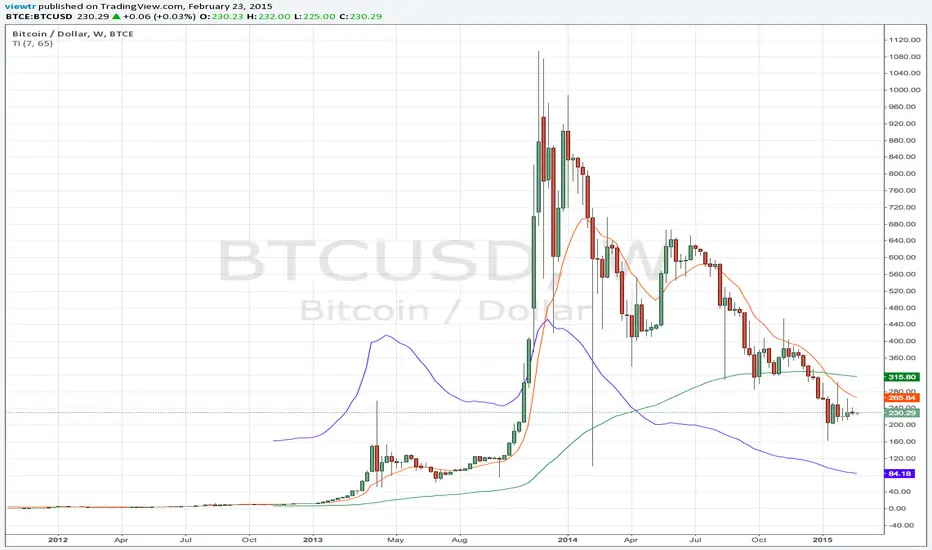
The Trend Intensity indicator measures the strength of the trend. Trend intensity tells us whether we are in an up or downtrend.
Ex:
A TI value of 150 means that the 7 day moving average is currently 50% above the 65 day moving average. This tells us that prices were moving up quickly in recent history.
A TI value of 80 tells us that the 7 day moving average is currently 20% below the 65 day moving average. This tells us that prices were moving down in recent history.
Script open-source
Nello spirito di TradingView, l'autore di questo script lo ha reso open source, in modo che i trader possano esaminarne e verificarne la funzionalità. Complimenti all'autore! Sebbene sia possibile utilizzarlo gratuitamente, ricordiamo che la ripubblicazione del codice è soggetta al nostro Regolamento.
Declinazione di responsabilità
Le informazioni e le pubblicazioni non sono intese come, e non costituiscono, consulenza o raccomandazioni finanziarie, di investimento, di trading o di altro tipo fornite o approvate da TradingView. Per ulteriori informazioni, consultare i Termini di utilizzo.