OPEN-SOURCE SCRIPT
Volume Bomb
I am republishing to use a clean chart. Previous one had too much of a mess. Idea for TradingView: Please allow us to change out the charts after publishing.
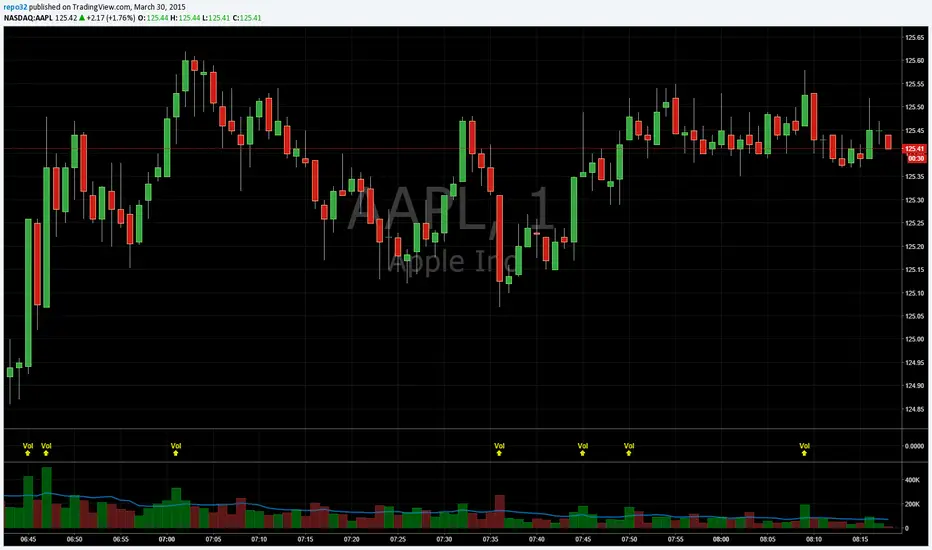
I like to know when volume spikes (only when it spikes). I am not interested in seeing the rest of the volume bars. I created this indicator to show me when it explodes (i.e. the name "Volume Bomb" , plus it sounds cool).
This indicator only shows you when volume exceeds the EMA of volume by whatever multiplier you set.
Default settings are the current volume with 10 EMA. Yellow arrowup will appear when volume is at 1.5x the 10 EMA.
Adjust it to your liking and particular stock.
Script open-source
In pieno spirito TradingView, il creatore di questo script lo ha reso open-source, in modo che i trader possano esaminarlo e verificarne la funzionalità. Complimenti all'autore! Sebbene sia possibile utilizzarlo gratuitamente, ricorda che la ripubblicazione del codice è soggetta al nostro Regolamento.
Declinazione di responsabilità
Le informazioni ed i contenuti pubblicati non costituiscono in alcun modo una sollecitazione ad investire o ad operare nei mercati finanziari. Non sono inoltre fornite o supportate da TradingView. Maggiori dettagli nelle Condizioni d'uso.