POC-Candle-EMA-ATR-LongShadow-50percCandleThis is a script for those who trade based on volume and smart money strategies.
Some of the features of this script:
- Display "Time Price Opportunity Chart". These points help traders to identify price opportunities over time and have a better analysis of the market.
- Mark candles that have traded more volume than previous candles.
- Mark candles whose body is at least and not more than 50% of the total candle size, these candles can be found more easily in smart money strategies.
- Mark spike candles to find FVG faster
- Mark candles that have a shadow of at least more than 380 points and can be good reversal points.
- EMA indicator to check the market trend
- DonchianChannel indicator to check the price trend on the chart
Regards
Spike
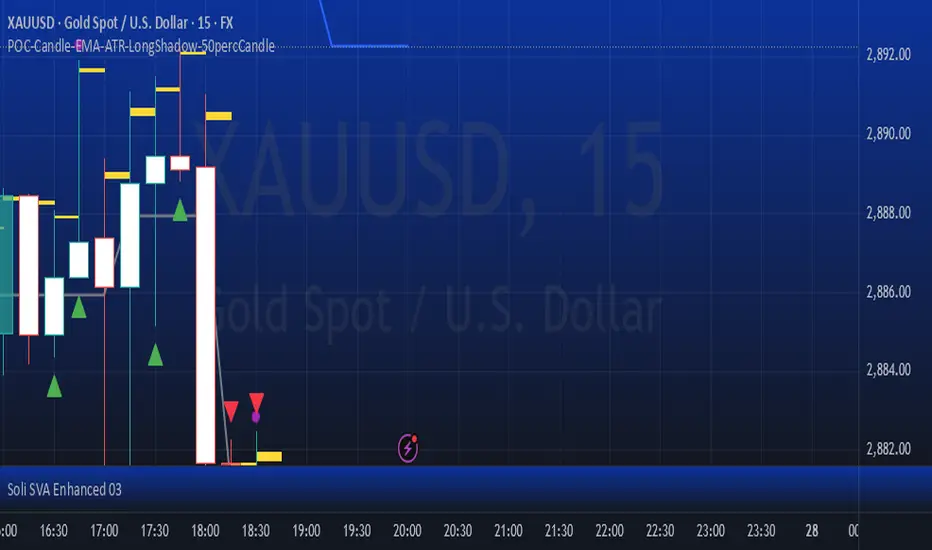
RG - Volume Spike DetectorRG - Volume Spike Detector is a comprehensive volume analysis tool designed to help traders identify significant volume activity across different tickers on TradingView. This indicator not only detects overall volume spikes and percentage changes but also approximates and analyzes buying and selling volume separately, providing valuable insights into market dynamics. With customizable parameters, visual cues, and built-in alerts, it's suitable for traders of all levels looking to monitor volume-based market movements.
Features
Volume Spike Detection:
Identifies when total volume exceeds a user-defined multiple of its moving average (default: 2x).
Separate detection for buying and selling volume spikes based on their respective moving averages.
Volume Change Analysis:
Calculates and displays the percentage change in total volume from the previous bar.
Highlights significant increases (>50%) or decreases (<-50%) with alert options.
Buy/Sell Volume Approximation:
Estimates buying and selling volume using price movement and range:
Up bars: Buying volume ≈ volume * (close - low)/(high - low)
Down bars: Selling volume ≈ volume * (close - low)/(high - low)
Handles edge cases (e.g., high = low) to ensure accurate calculations.
Ideal For
Day traders monitoring sudden volume surges
Swing traders analyzing volume trends
Market analysts studying buying vs. selling pressure
This indicator empowers traders with a robust tool to track volume dynamics, offering both visual clarity and actionable alerts for informed decision-making.

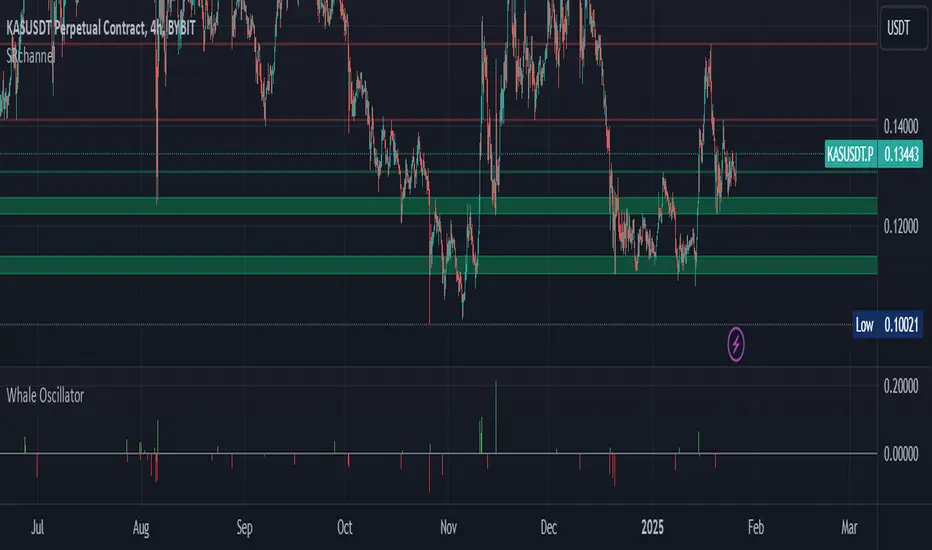
Whale Activity Impact OscillatorThe "Whale Activity Impact Oscillator" is a Pine Script v6 component designed to identify abnormal price movements caused by potential whale activity in the crypto market.
Here's how it works:
Inputs: The script allows users to configure the volume spike multiplier, price spike multiplier, lookback period, minimum volume threshold, and thresholds for strong buy and sell signals.
Data Calculations: It calculates the average volume and average percentage price change over the specified lookback period.
Whale Detection Logic: The script detects a volume spike if the current volume exceeds the average volume by the specified multiplier. It detects a price spike if the percentage price change exceeds the average by the specified multiplier.
Signals: A buy signal is generated when both a volume spike and a price increase are detected. A sell signal is generated when both a volume spike and a price decrease are detected.
Output: The oscillator is displayed as a histogram below the price chart. Green bars indicate buy signals, red bars indicate sell signals, and gray bars indicate normal activity. The height of the bars is proportional to the magnitude of the price change.
Alerts: The script includes alerts for whale buying and selling detected signals.
Edge Cases: The script avoids false signals in low-liquidity environments by setting a minimum volume threshold and filtering out signals during low market activity.
This component can be added to a TradingView chart to help traders identify potential whale activity and make informed trading decisions.
FuTech V-Spike & V-HighlighterFuTech V-Spike & V-Highlighter
In the context of trading and technical analysis, this volume spike & volume highlighter indicator is the perfect indicator used to assess market activity and make informed trading decisions.
Let's Understand in brief as below :
1) Volume Spike :
A volume spike refers to a sudden, significant increase in trading volume compared to the average volume over a specific period.
This spike can indicate heightened interest in a particular security, often preceding price movements.
Traders may look for volume spikes as signals for potential buy or sell opportunities because they can suggest that a stock is experiencing increased activity, possibly due to news, earnings releases, or other catalysts.
Characteristics of a Volume Spike:
Assess the sudden increase in trading volume.
It Can occur in both upward and downward price movements.
Often compared to the average volume over a defined period (e.g., the last 20 days).
2) Volume Highlighter:
A volume highlighter emphasizes significant changes in trading volume on a price chart. This indicator typically uses color coding to highlight periods of high volume, making it easier for traders to identify volume spikes at a glance.
How this indicator works:
a) Volume Spike will calculate the highest volume spike as per the user defined threshold multiplier. (Multiplier = when volume exceeds a certain threshold)
b) The threshold Multiplier can be set based on a fixed number or as a multiple of the Exponential Moving Average volume. Volume Spike Multiplier default is 1.5, means the EMA volume should cross 1.5 times the user defined lookback period
c) The result is derived from the user defined lookback candles by using its EMA instead of SMA, which will give us more precise results.
d) By default, last 10 candles EMA average is used to calculate the Volume Spike but you can choose your lookback period as many days, weeks, months, years of your choice !
e) In Volume Spike -
- Green candle will show Yellow color Bar as Bullish sentiments, whereas
- Red candle will show Black Bar as Bearish sentiments.
f) Volume Highlighter will highlight the candles background if the highest volume is crossing as per the the user defined lookback period
g) Default Lookback period is 20, Color coding (e.g., Blue for bullish spikes, Red for bearish spikes) helps traders quickly assess the volume context.
h) Volume Highlighter plotting shapes and positions can be modified
Illustration:
From the Above pic,
If last Volume Spike is 10 lookback candles, Spike multiplier is 1.5 and Highlighter lookback candles is 20,
Then yellow candle means the spike in volume which is 1.5 times higher than the last 10 candles
Highlighting color defines the highest volumes trading from the last 20 candles which is either Blue (Bullish) or Red (Bearish) sentiments
Conclusion :
Using FuTech V-Spike & V-Highlighter indicator - will help traders identify potential trading opportunities and better understand market dynamics.
By analyzing volume in conjunction with price movements, traders can make more informed decisions based on market sentiment.
Thank you !
Jai Swaminarayan Dasna Das !
He Hari ! Bas Ek Tu Raji Tha !

Volume CalendarDescription:
The indicator displays a calendar with Volume data for up to 6 last months. It is designed to work on any timeframe, but works best on Daily and below. It is also consistent in that it displays the same data even if you go to lower timeframes like 5 minutes (even though the data is used is Daily).
Features:
- displays volume data for last N months (volume, volume change, % of weekly, monthly and yearly volume)
- display total volume for each month
- display monthly sentiment
- find dates with volume spikes
Inputs:
- Number of months -> how many last months of data to display (from 1 to 6)
- Volume Type -> display only Bullish, only Bearish or all volume
- Cell color is based on -> Volume - the brighter the cell the higher volume was on that day; Volume Change - the brighter the cell the higher was the volume change that day; Volume Spike - the brighter the cell the higher was volume spike that day (volume spike is based on volume being above its average over last N candles)
- Cell color timeframe -> Weekly - the cell color is calculated comparing volume of that cell with weekly volume; Monthly - comparing volume with monthly volume
- Use volume for sentiment -> take the volume into account when calculating monthly sentiment (otherwise calculate it based on number of Bullish and Bearish days in the month)
- Spike Average Period -> period of the moving average used for spike calculation
- Spike Threshold -> current volume must be this many times greater than the average for it to be considered a spike
- Table Size -> size of the table
- Theme -> colouring of the table

Volume Spike IndicatorHello dear traders,
Today we're discussing an indicator I've coded: the Volume Spike Indicator (VSI).
The indicator isn't a groundbreaking invention and certainly not a novelty. Nevertheless, I haven't seen this version of the indicator on TradingView before, so I'd like to introduce it.
1. The Origin of the Idea:
We're all familiar with volume charts: A volume chart visually represents the trading activity for a specific asset over a certain period, indicating the total number of shares or contracts traded.
We also know that volume spikes can significantly impact the market. A volume spike represents an extreme anomaly, a day, week, or month with an extraordinary amount of trading. However, recognizing these spikes in practice isn't always straightforward. What constitutes high volume? How do we define and identify it? The answers to these questions aren't easy.
It's commonly said that a volume spike could be identified if the volume is 25% more than the average of the two weeks prior, but how do you measure this 25%? It's not always easy to calculate, especially in real-time.
This challenge led me to develop the concept into an indicator.
How Does It Work?
Imagine being able to "feel" the market's energy like a surfer feels the ocean. The VSI does something similar by examining trading volume and comparing it to what has been typical over the past few weeks. Here's a quick look at the magic behind it:
Step 1: Establishing the Baseline: We start by establishing a baseline, i.e., the average trading volume over a given period. Let's use the last 10 days as the default setting. We choose 10 days because, in the traditional stock market, 10 days represent two weeks if you subtract weekends. This gives us a fixed line to compare against.
Step 2: Recognizing Peaks: Next, we look for days when the trading volume significantly exceeds this average. The size of the jump is where you have a say. You can set a threshold, such as 25%, to define what you consider a volume spike.
Step 3: The Calculation: This is where the math comes into play. We calculate the percentage change in today's volume compared to the average volume of the last 10 days. For example, if today's volume is 30% above the average and you've set your threshold at 25%, the VSI will recognize this as a spike.
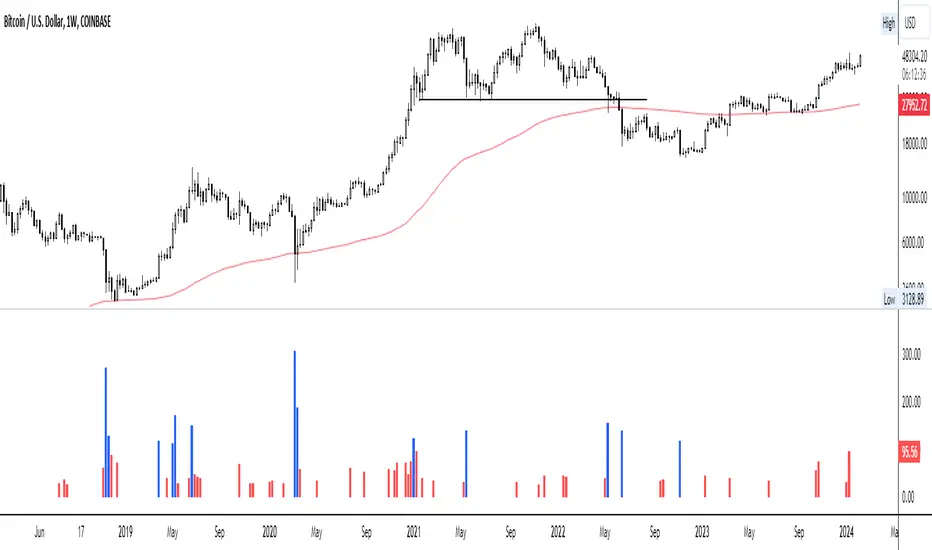
Step 4: Visual Cue: These spikes are then plotted on a graph, with each spike represented as a bar. The height of the bar indicates the spike's percentage size, so you can see at a glance how significant a spike is.
Step 5: Intuitive Color Coding: For quick analysis, the VSI employs a color-coding system. Exceptionally high peaks, such as those exceeding a 100% increase, are highlighted in blue to emphasize their importance. Other peaks are shown in red, creating a visual hierarchy for quick volume data interpretation.
Why This Matters:
Identifying these spikes can help pinpoint the beginning or end of a trend. The idea is that when trading peaks at a certain level, there might be no more buyers or sellers willing to engage at that price level. Volume peaks, and a reversal is likely imminent. It's a simple yet effective concept. Therefore, it's crucial to use this indicator in the context of the trend, as not every spike carries the same significance.
Customizable:
The beauty of the VSI lies in its flexibility. Trading futures? You might want to adjust the averaging period to 14 days to better suit your market. You have full control over the settings to tailor them to your trading style.
Interpreting the Figures:
A positive percentage indicates a volume spike above the average – the higher the percentage, the more significant the spike.
If the percentage exceeds a certain threshold (which you can set, e.g., 25%), it signals a volume spike, indicating increased market activity that could precede significant price movement.
What makes the VSI genuinely adaptable is your ability to tweak the parameters to suit your needs.
Are you trading in a volatile market? Extend the SMA period to smooth out the noise. Trading in a 24-hour market? Adjust the length of your SMA. Seeking finer details? Shorten it. The VSI is yours to adapt to your trading strategy.
---------------------------------------------------------------------------------------------------------------------
As we wrap up this introduction to the Volume Spike Indicator, I hope you're as excited about its potential as I am. This tool, born out of curiosity and a desire for clarity in the vast ocean of market data, is designed to be your ally in navigating the waves of trading activity.
Remember, the true power of the VSI lies not just in its ability to highlight significant volume spikes, but in its adaptability to your unique trading style and needs. Whether you're charting courses through the tumultuous seas of day trading or navigating the broader currents of long-term investments, the VSI is here to offer insights and guidance.
I encourage you to experiment with it, customize it, and see how it can enhance your trading strategy. And as you do, remember that every tool, no matter how powerful, is just one piece of the puzzle. Combine the VSI with your knowledge, experience, and intuition to make informed and strategic trading decisions.
Thank you for taking the time to explore the Volume Spike Indicator with me.
Best Regards,
Karim Subhieh
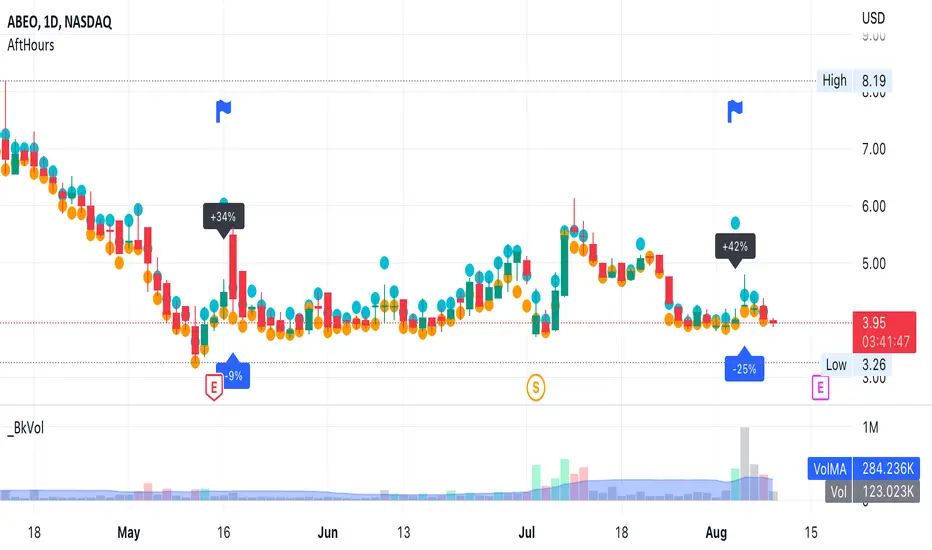
AfterHours Spike DetectorThe script pulls Lower Timeframe (30min) data to draw High/Low of Out-of-hours/AfterHours session (post-market session & next day pre-market session) on the Daily regular session chart. It then identifies significant AfterHours price changes and what happens to these price Spikes by the Open of the next day regular session.
You can change:
wether to show AfterHours High/Lows
wether to show AfterHours price Spikes
the AfterHours price Spike threshold (default = +/- 10%)
Neglected Volume by DGTVolume is one piece of information that is often neglected, however, learning to interpret volume brings many advantages and could be of tremendous help when it comes to analyzing the markets. In addition to technicians, fundamental investors also take notice of the numbers of shares traded for a given security.
What is Volume?
The volume represents all the recorded trades for a security that occurs in a given time interval. It is a measurement of the participation, enthusiasm, and interest in a given security. Think of volume as the force that drives the market. Volume substantiates, energizes, and empowers price. When volume increases, it confirms price direction; when volume decreases, it contradicts price direction.
In theory, increases in volume generally precede significant price movements. However, If the price is rising in an uptrend but the volume is reducing or unchanged, it may show that there’s little interest in the security, and the price may reverse.
A high volume usually indicates more interest in the security and the presence of institutional traders. However, a rapidly rising price in an uptrend accompanied by a huge volume may be a sign of exhaustion.
Traders usually look for breaks of support and resistance to enter positions. When security break critical levels without volume, you should consider the breakout suspect and prime for a reversal off the highs/lows
Volume spikes are often the result of news-driven events. Volume spike will often lead to sharp reversals since the moves are unsustainable due to the imbalance of supply and demand
note : there’s no centralized exchange where trades are recorded, so the volume data represents what happens at a particular exchange only
In most charting platforms, the volume indicator is presented as color-coded bars, green if the security closes up and red if the security closed lower, where the height of the bars show the amount of the recorded trades
Within this study, Relative Volume , Volume Weighted Bars and Volume Moving Average are presented, where Relative Volume relates current trading volume to past trading volume over long period, Volume Weighted Bars presents price bars colored based on short period past trading volume average, and Volume Moving Average is average of volume over shot period
Relative Volume is presented as color-coded bars similar to regular Volume indicator but uses four color codes instead two. Notable increases of volume are presented in green and red while average values with back and gray, hence adding ability to emphasis notable increases in the volume. It is kind of a like a radar for how "in-play" a security is. Users are allowed to change the threshold, default value is set to Fibonacci golden ration standard deviation away from its moving average.
Volume Weighted Bars, a study of Kıvanç Özbilgiç, aims to present if price movements are supported by Volume. Volume Weighted Bars are calculated based on shot period volume moving average which will reflect more recent changes in volume. Price actions with high volume will be displayed with darker colors, average volume values will remain as they are and low volume values will be indicated with lighter colors.
Volume Moving Average, Is short period volume moving average, aims to display visually the volume changes. Please not that Relative Volume bars are calculated based on standard deviation of long volume moving average.
What Else?
Apart from the volume itself, your ability to assess what volume is telling you in conjunction with price action can be a key factor in your ability to turn a profit in the market. It makes little sense to analyze the volume alone. To correctly interpret the volume data, it shall be seen in the light of what the price is doing. there are a lot of other indicators that are based on the volume data as well as price action. Analysing those volume indicators has always helped traders and investors to better understand what is happening in the market.
Here are the ones adapted with this study. Some of them used as a source for our aim, some adapted as they are with slight changes to fit visually to this study and please note that the numerical presentation may differ from their regular use
• On Balance Volume
• Divergence Indicator
• Correlation Coefficient
• Chaikin Money Flow
Shortly;
On Balance Volume
The On Balance Volume indicator, is a technical analysis indicator that relates volume flow to changes in a security’s price. It uses a cumulative total of positive and negative trading volume to predict the direction of price. The OBV is a volume-based momentum oscillator, so it is a leading indicator — it changes direction before the price
Granville, creator of OBV, proposed the theory that changes in volume precede price movements in a measurable way. He believed that volume was the main force behind major market moves and thought of OBV’s prediction of price changes as a compressed spring that expands rapidly when released.
It is believed that the OBV shows the interactions between the institutional and retail traders in the market
If the price makes a new high, the OBV should also make a new high. If the OBV makes a lower high when the price makes a higher high, there’s a classical bearish divergence — indicating that only the retail traders are buying. Another type of bearish divergence occurs when the price remains relatively quiet and fails to make a higher high but the OBV soars higher than the previous high — indicating that the institutional traders are accumulating short positions. On the other hand, if the price makes a lower low and the OBV makes a higher low, there is a classical bullish divergence, showing that the institutional traders don’t believe in that move
With this study, Momentum and Acceleration (optional) of OBV is calculated and presented, where momentum is most commonly referred to as a rate and measures the acceleration of the price and/or volume of a security. It is also referred to as a technical analysis indicator and oscillator that is able to determine market trends.
Additionally, smoothing functionality with Least Squares Method is added
Divergences especially, should always be noted as a possible reversal in the current trend, so the divergence indicator is adapted with this study where the Momentum of OBV is assumed as Oscillator with similar usages as to RSI. Divergence is most often used to track and analyze the momentum in an asset’s price and the odds of a price reversal within the current trend. The divergence indicator warns traders and technical analysts of changes in a price/volume trend, oftentimes that it is weakening or changing direction.
Correlation Coefficient
The correlation coefficient is a statistical measure of the strength of the relationship between the relative movements of two variables. A correlation of -1.0 shows a perfect negative correlation, while a correlation of 1.0 shows a perfect positive correlation. A correlation of 0.0 shows no linear relationship between the movement of the two variables. In other words, the closer the Correlation Coefficient is to 1.0, indicates the instruments will move up and down together as it is mostly expected with volume and price. So the Correlation Coefficient Indicator aims to display when the price and volume (on balance volume) is in correlation and when not. With this study blue represent positive correlation while orange negative correlation. The strength of the correlation is determined by the width of the bands, to emphasis the effect horizontal lines are drawn with values set to 0.5 and -0.5. the values above 0.5 (or below -0.5) shows stronger correlation.
Chaikin Money Flow , provide optionally as a companion indicator
The Chaikin money flow indicator (CMF) is a volume indicator that measures the money flow volume over a chosen period. The money flow volume is a measure of the volume and where the price closed relative to the trading session’s range. It comes from the idea that buying pressure is indicated by a rising volume and recurrent closes in the upper part of the session’s price range while selling pressure is demonstrated by an increasing volume and repeated closes in the lower part of the price range.
Both buying and selling pressures are accompanied by an increase in volume, but the location of the closing prices are in accordance with the direction of price
Special thanks to @InvestCHK and @hjsjshs , who have enormously contributed while preparing this study
related studies:
Disclaimer:
Trading success is all about following your trading strategy and the indicators should fit within your trading strategy, and not to be traded upon solely
The script is for informational and educational purposes only. Use of the script does not constitute professional and/or financial advice. You alone have the sole responsibility of evaluating the script output and risks associated with the use of the script. In exchange for using the script, you agree not to hold dgtrd TradingView user liable for any possible claim for damages arising from any decision you make based on use of the script


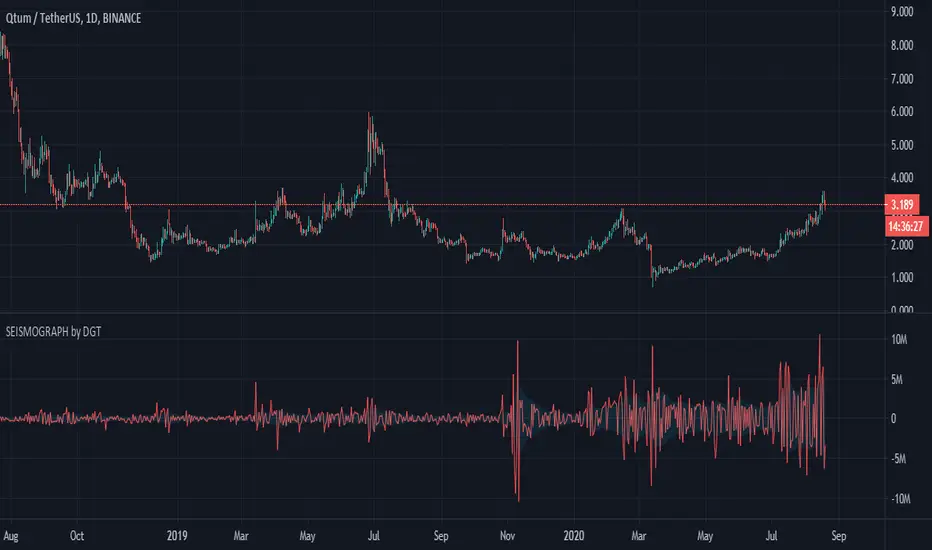
Earthquake Effect by DGTInstitutional investors have a profound impact on financial instruments prices because of the large volume, and their trading activities can greatly impact the price of financial instruments. They sometimes may split trades over time in order to not make a material impact and of course not to decrease liquidity to the point where there may be no one to take the other side of the trade.
Institutional investors (Smart Money) may create an Elephant Effect on the prices of financial instruments, and this study aims to display by emphasizing high volume changes
In the memory of the North Anatolian Earthquake that struck on August 17, 1999, that we remember with pain today, and similarities of plotting outcomes to seismograph plotting I preferred to name this study as Earthquake Effect (SEISMOGRAPH)
Disclaimer:
Trading success is all about following your trading strategy and the indicators should fit within your trading strategy, and not to be traded upon solely
The script is for informational and educational purposes only. Use of the script does not constitute professional and/or financial advice. You alone have the sole responsibility of evaluating the script output and risks associated with the use of the script. In exchange for using the script, you agree not to hold dgtrd TradingView user liable for any possible claim for damages arising from any decision you make based on use of the script
Volume SpikeDetect current bar's volume is at least Ratio times than average volume of previous "Look back" bars.


PorcupineDisplays "spike days" by colouring the bars (Default: yellow for a Spike High and blue for a Spike Low)
Spike Day's definition taken from Jack D Schwager's Book: A Complete Guide to the Futures Market: Technical Analysis, Trading Systems, Fundamental Analysis, Options, Spreads, and Trading Principles
A spike is:
A wide difference between the spike high and the highs of the preceding and succeeding days.
A close near the low of the day's range.
A substantial price advance preceding the spike's formation.
The more extreme each of these conditions, the greater the likelihood that a spike high will prove to be an important relative high or even a major top.
(inverse is true for lows, basically)
Enjoy!

Volume SpikeThis script identifies volume spikes as a percentage change of the current bar's volume compared to the previous 3 bars' average volume.

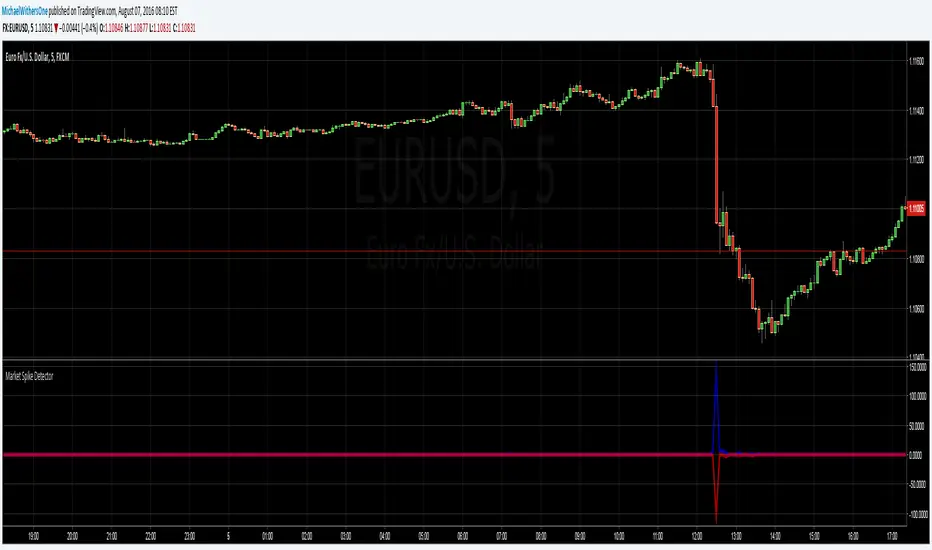
Seismic Market Spike Detector v1.0 Seismic Market Spike Detector v1.0
This indicator helps identify spikes in market activity , typified by bars with extreme open / close or high / low prices.
This indicator plots 2 lines. The Blue line simply depicts extreme price movements with in that bar regardless of the initial opening price of the closing price of the bar. This allows you to get an insight into the current volatility of the price at that time in the market. Quite often big price swings with in bars are missed as people pend to tunnel vision on the open or close price - or other indicators derived from open / close.
The Red line is similar to the blue bar as it depicts extreme price movements with in the bar , but it will show the direction the market moved in by the close of the bar - and relatively how much the market moved. This is helpful for spotting breakout price action or short term spikes. Quite often after a breakout the market will restore itself to an equilibrium in the opposite direction. Sometimes this happens with an opposing aggressive spike , some times it makes a steady return to a known price level. Either way its a great time to place entry orders if you are looking to turn a fast profit or alternatively a good warning of forth coming price volatility.
Here are some tips for analysing the red and blue lines :
1)If the red line is pointing upwards , this indicates a sharp rise in the price.
2)If the red line is pointing downwards , this indicates a sharp fall in the price.
3)If the red line is flat but the blue line is spiked in either direction - this indicates the price was volatile with in the bar , but the price closed relatively near to the surrounding price bars. Perhaps a limit / stop triggered by this kind of activity - this is an easy way to determine why and re-enter.
4)If the red and the blue lines are flat - the price is steadily moving with a trend or trading sideways in a confined range.
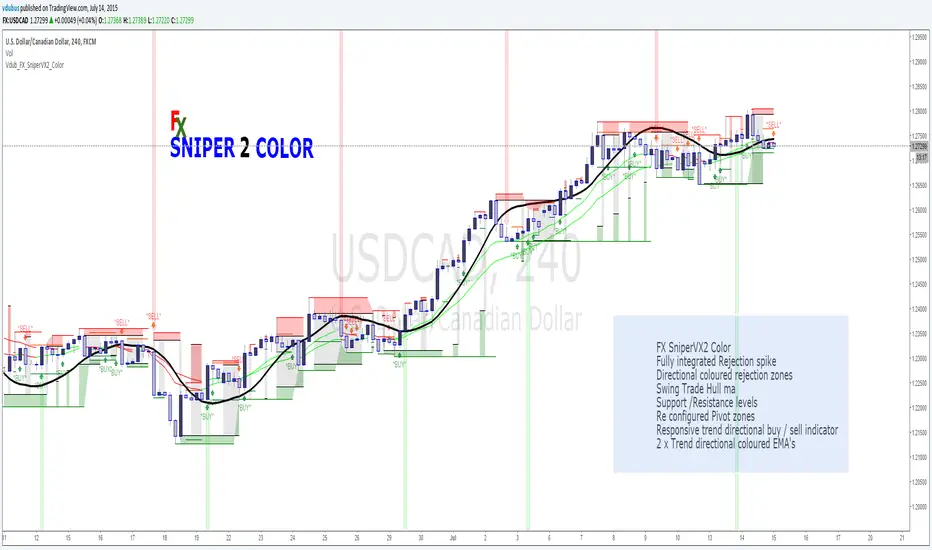
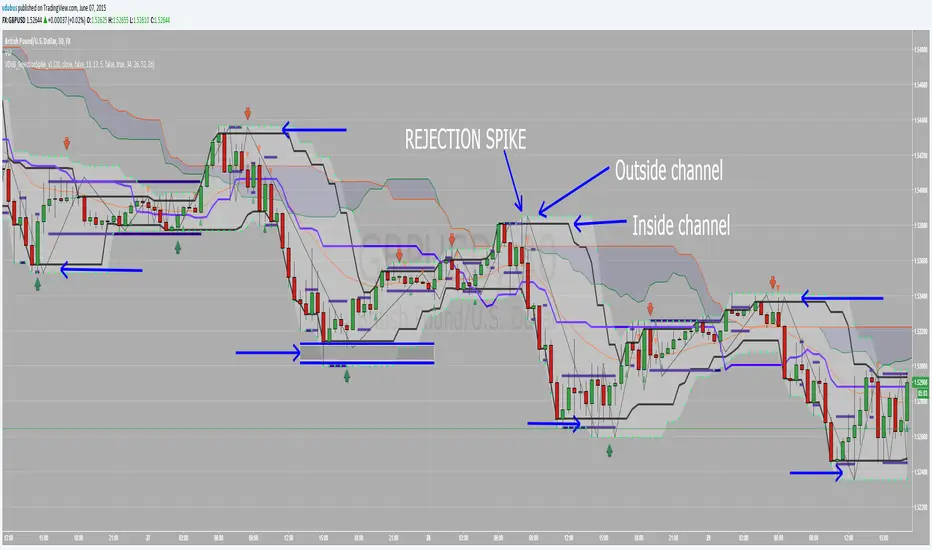
Vdub FX SniperVX2 Color v2FX SniperVX2 Color
Fully integrated Rejection spike
Directional coloured rejection zones
Swing Trade Hull ma
Support /Resistance levels
Re configured Pivot zones
Responsive trend directional buy / sell indicator
2 x Trend directional coloured EMA's
Sniper series
VDUB_RejectionSpike_v1 this indicator is for use with the Rejection Spike Strategy I recently publish
Have't had chance to test it yet so feel free to try.
Details of the strategy are listed in the link below
Volume BombI am republishing to use a clean chart. Previous one had too much of a mess. Idea for TradingView: Please allow us to change out the charts after publishing.
I like to know when volume spikes (only when it spikes). I am not interested in seeing the rest of the volume bars. I created this indicator to show me when it explodes (i.e. the name "Volume Bomb" , plus it sounds cool).
This indicator only shows you when volume exceeds the EMA of volume by whatever multiplier you set.
Default settings are the current volume with 10 EMA. Yellow arrowup will appear when volume is at 1.5x the 10 EMA.
Adjust it to your liking and particular stock.