OPEN-SOURCE SCRIPT
Aggiornato (RSI + CCI) × (MACD/ATR)^2
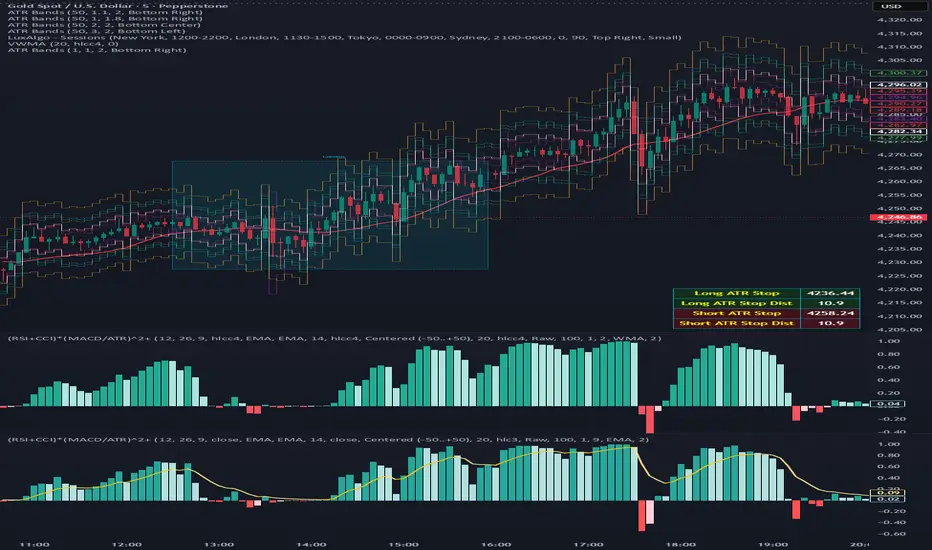
⚙️ (RSI + CCI) × (MACD / ATR)² Composite — Normalized, Compressed, Dynamic Colors
This advanced composite oscillator merges three powerful momentum indicators — RSI, CCI, and MACD — into one normalized and volatility-adjusted signal that reacts smoothly across all markets.
By dividing MACD by ATR (Average True Range), the indicator self-scales for different symbols, and an optional tanh-like compression prevents extreme spikes while keeping the movement fluid and responsive.
🧩 Core Formula
(RSI + CCI) × (MACD / ATR)²
(optionally passed through a tanh compression for stability)
RSI and CCI are normalized (RSI ÷ 50, CCI ÷ 100) → roughly −2 to +2 range.
MACD is volatility-adjusted by ATR → scale-independent between assets.
The result is centered around 0 for clear bullish/bearish momentum comparison.
🎨 Visual Features
🟢🔴 Dynamic 4-Color Histogram
Positive + Rising = Strong Teal
Positive + Falling = Light Teal
Negative + Falling = Strong Red
Negative + Rising = Light Red
🟡⚫ 4-Color Smoothing Line
Positive & Rising = Bright Yellow
Positive & Falling = Soft Yellow
Negative & Rising = Grey
Negative & Falling = Dark Grey
Zero-centered layout for intuitive bullish/bearish visualization.
⚙️ Adjustable Parameters
Individual RSI, CCI, and MACD lengths and sources.
ATR length for volatility normalization.
Optional tanh-style compression with adjustable gain (to keep values in ±1 range).
Fully customizable colors and line widths for both bars and smoothing line.
🔔 Alerts
Triggered automatically when the composite crosses above or below zero, signaling potential trend reversals or momentum shifts.
💡 How to Use
Composite > 0 → Bullish momentum ↑
Composite < 0 → Bearish momentum ↓
A brightening line or bar = momentum accelerating.
A fading color = momentum weakening or reversal forming.
Combine with higher-timeframe trend filters (EMA, VWAP, Supertrend) for confirmation.
Note di rilascio
OverviewThis indicator fuses RSI, CCI, and a volatility-normalized MACD into one smooth, scale-independent oscillator.
By dividing MACD by ATR, the output becomes volatility-adjusted and self-scaling across all markets, making it easier to compare momentum strength between instruments.
Key Features
Dynamic 4-color histogram showing positive/negative + rising/falling momentum
4-color smoothed signal line for clarity of trend strength
Adjustable RSI, CCI, MACD, and ATR lengths
Optional tanh-style compression and smoothing type selector (EMA, SMA, WMA, etc.)
Centered zero-line view for clear bullish/bearish shifts
Alerts when the composite crosses above/below zero
How to Use
Above zero → bullish momentum
Below zero → bearish momentum
Brightening color → acceleration
Fading color → slowdown or reversal
Attribution
The idea of volatility normalization (MACD ÷ ATR) is conceptually inspired by “MACD-v: Volatility Normalised Momentum” by Alex Spiroglou (2015 idea, publicly presented 2022).
His pioneering research received the NAAIM Founders Award and the CMT Association Charles H. Dow Award in 2022.
No code from the MACD-v paper is used — this script is an independent implementation acknowledging his foundational concept.
Created by: [Hay_C]
Independent development and design © 2025
Script open-source
Nello spirito di TradingView, l'autore di questo script lo ha reso open source, in modo che i trader possano esaminarne e verificarne la funzionalità. Complimenti all'autore! Sebbene sia possibile utilizzarlo gratuitamente, ricordiamo che la ripubblicazione del codice è soggetta al nostro Regolamento.
HK-Uk Hoiliday Trader, Short-term programme trade, Forex-Commodities-Crypto, 2005-2023
Declinazione di responsabilità
Le informazioni e le pubblicazioni non sono intese come, e non costituiscono, consulenza o raccomandazioni finanziarie, di investimento, di trading o di altro tipo fornite o approvate da TradingView. Per ulteriori informazioni, consultare i Termini di utilizzo.