PROTECTED SOURCE SCRIPT
Standard Deviation Expectation
Standard Deviation Expectation
- First off I want to thank and give credit to #Stockmarketupdate for introducing this idea to me while stumbling across his script for plotting the standard deviation above each candle/price.
Applying Standard Deviation Expectation can aide traders with insight to price projection, expectation, as well as, give hint to price exhaustion.
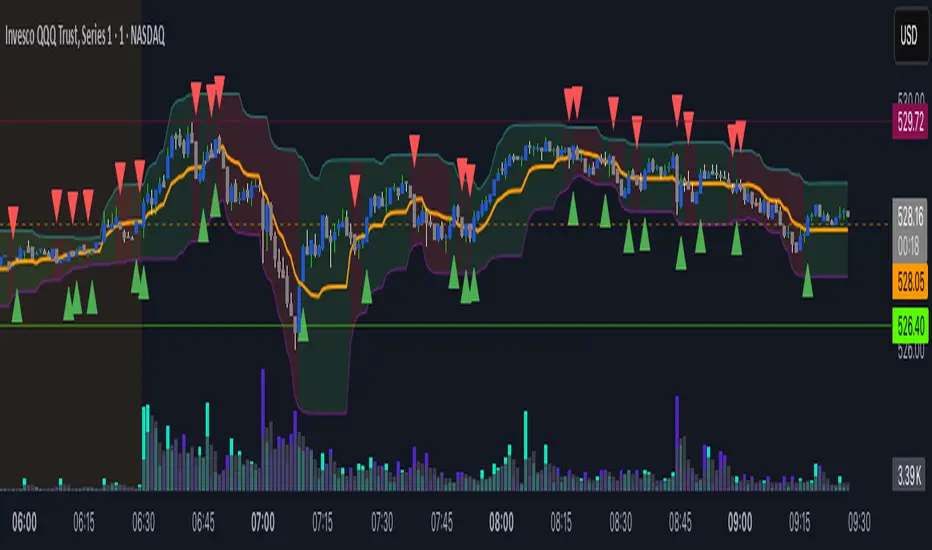
This indicator helps you identify dynamic support and resistance levels based on price volatility — specifically using standard deviation — on your chosen time frame or a higher time frame (multi-time frame).
It calculates a range around recent price action that adapts based on how volatile the market is.
It plots three lines:
Resistance line (upper boundary)
Support line (lower boundary)
Mid-line (middle of support and resistance)
It colors the area between support and resistance green or red depending on whether the current price is above or below the mid-line.
It alerts you when price crosses the mid-line either upward or downward.
Explanation of Components
Standard deviation is a statistical measure that tells you how much prices vary from the average.
This script calculates Standard Dev. on a selected price source (usually close price) over a specified length (default 8 bars).
Then it multiplies this by a “multiplier” (default 1.75) to set how wide the expected range should be.
More volatility → wider range; less volatility → tighter range.
2. Multi-Timeframe (MTF) Input
You can select a different timeframe (like 1H, 4H, daily) to base calculations on, even if you’re viewing a lower timeframe chart (like 15 min).
This helps smooth out noise and get more meaningful levels from higher timeframes.
3. Calculating Deviation High and Low
Based on whether the higher timeframe candle is bearish or bullish, the indicator adjusts the expected high and low by adding or subtracting the standard deviation.
This creates a dynamic “band” or range around the price on the higher timeframe.
4. Support and Resistance Lines
It calculates the highest deviation high and the lowest deviation low over a look-back period.
Then it smooths these extremes using an Exponential Moving Average (EMA) to avoid choppy lines.
The result is two smooth, adaptive lines — resistance and support.
5. Mid-line
Simply the average of the support and resistance lines.
Acts as a pivot or equilibrium point between support and resistance.
6. Offset
Allows you to shift the lines forwards by a number of bars, which can help with visual alignment or back-testing.
7. Color Fill
The space between support and resistance is filled with a transparent green color if price is above the midline, red if below.
This gives a quick visual cue of bullish or bearish bias.
8. Alerts on Midline Cross
The indicator generates alert conditions when price crosses the midline:
Crosses above → possible bullish sign
Crosses below → possible bearish sign
You can set alerts in Trading-view using these to get notified.
*Don’t rely solely on this indicator. Use it alongside price action and other indicators.
Play with the multiplier and length inputs to see what fits your trading style and the asset’s volatility.
The multi-time frame option is powerful — try using daily or 4H on a 15-min chart to get smoother levels.
Use alerts for mid-line crosses to help you catch potential trade setups without staring at the screen constantly. *
Disclaimer: The information contained in this script does not constitute financial advice or a solicitation to buy or sell any securities of any type. I will not accept liability for any loss or damage, including without limitation any loss of profit, which may arise directly or indirectly from the use of or reliance on such information.
All investments involve risk, and the past performance of a security, industry, sector, market, financial product, trading strategy, back-test, or individual's trading does not guarantee future results or returns. Investors are fully responsible for any investment decisions they make. Such decisions should be based solely on an evaluation of their financial circumstances, investment objectives, risk tolerance, and liquidity needs.
This script was produced for educational purposes!
Enjoy!
- First off I want to thank and give credit to #Stockmarketupdate for introducing this idea to me while stumbling across his script for plotting the standard deviation above each candle/price.
Applying Standard Deviation Expectation can aide traders with insight to price projection, expectation, as well as, give hint to price exhaustion.
This indicator helps you identify dynamic support and resistance levels based on price volatility — specifically using standard deviation — on your chosen time frame or a higher time frame (multi-time frame).
It calculates a range around recent price action that adapts based on how volatile the market is.
It plots three lines:
Resistance line (upper boundary)
Support line (lower boundary)
Mid-line (middle of support and resistance)
It colors the area between support and resistance green or red depending on whether the current price is above or below the mid-line.
It alerts you when price crosses the mid-line either upward or downward.
Explanation of Components
Standard deviation is a statistical measure that tells you how much prices vary from the average.
This script calculates Standard Dev. on a selected price source (usually close price) over a specified length (default 8 bars).
Then it multiplies this by a “multiplier” (default 1.75) to set how wide the expected range should be.
More volatility → wider range; less volatility → tighter range.
2. Multi-Timeframe (MTF) Input
You can select a different timeframe (like 1H, 4H, daily) to base calculations on, even if you’re viewing a lower timeframe chart (like 15 min).
This helps smooth out noise and get more meaningful levels from higher timeframes.
3. Calculating Deviation High and Low
Based on whether the higher timeframe candle is bearish or bullish, the indicator adjusts the expected high and low by adding or subtracting the standard deviation.
This creates a dynamic “band” or range around the price on the higher timeframe.
4. Support and Resistance Lines
It calculates the highest deviation high and the lowest deviation low over a look-back period.
Then it smooths these extremes using an Exponential Moving Average (EMA) to avoid choppy lines.
The result is two smooth, adaptive lines — resistance and support.
5. Mid-line
Simply the average of the support and resistance lines.
Acts as a pivot or equilibrium point between support and resistance.
6. Offset
Allows you to shift the lines forwards by a number of bars, which can help with visual alignment or back-testing.
7. Color Fill
The space between support and resistance is filled with a transparent green color if price is above the midline, red if below.
This gives a quick visual cue of bullish or bearish bias.
8. Alerts on Midline Cross
The indicator generates alert conditions when price crosses the midline:
Crosses above → possible bullish sign
Crosses below → possible bearish sign
You can set alerts in Trading-view using these to get notified.
*Don’t rely solely on this indicator. Use it alongside price action and other indicators.
Play with the multiplier and length inputs to see what fits your trading style and the asset’s volatility.
The multi-time frame option is powerful — try using daily or 4H on a 15-min chart to get smoother levels.
Use alerts for mid-line crosses to help you catch potential trade setups without staring at the screen constantly. *
Disclaimer: The information contained in this script does not constitute financial advice or a solicitation to buy or sell any securities of any type. I will not accept liability for any loss or damage, including without limitation any loss of profit, which may arise directly or indirectly from the use of or reliance on such information.
All investments involve risk, and the past performance of a security, industry, sector, market, financial product, trading strategy, back-test, or individual's trading does not guarantee future results or returns. Investors are fully responsible for any investment decisions they make. Such decisions should be based solely on an evaluation of their financial circumstances, investment objectives, risk tolerance, and liquidity needs.
This script was produced for educational purposes!
Enjoy!
Script protetto
Questo script è pubblicato come codice protetto. Tuttavia, è possibile utilizzarle liberamente e senza alcuna limitazione – ulteriori informazioni qui.
Declinazione di responsabilità
Le informazioni e le pubblicazioni non sono intese come, e non costituiscono, consulenza o raccomandazioni finanziarie, di investimento, di trading o di altro tipo fornite o approvate da TradingView. Per ulteriori informazioni, consultare i Termini di utilizzo.