OPEN-SOURCE SCRIPT
Aggiornato Linear Regression Channel Breakout Strategy

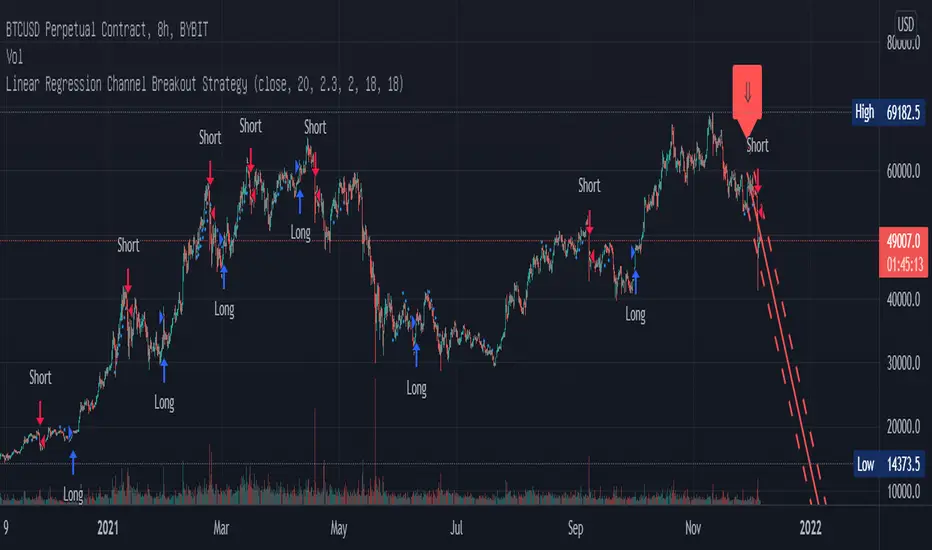
This strategy is based on LonesomeTheBlue's Linear Regression Channel Indicator. First of all, I would like to thank LonesomeTheBlue. Breaking the Linear Regression Channel to close the candle triggers a Long or Short signal. If the slope of the Linear Regression Channel is positive, it is Short when it breaks out the lower line, and when the slope is negative, it is Long when it breaks out the upper line. The default is optimized for 8-hour candles, and for other hour candles, find the optimal value yourself. Below is a description of LonesomeTheBlue's Linear Regression Channel.
이 전략은 LonesomeTheBlue의 Linear Regression Channel Indicator를 기반으로 만들어졌습니다. 우선 LonesomeTheBlue님께 감사의 말씀을 드립니다. Linear Regression Channel을 돌파하여 봉 마감하면 Long 또는 Short 신호를 트리거합니다. Linear Regression Channel의 기울기가 양인 경우 하단 라인을 돌파하면 Short이고 그 기울기가 음인 경우 상단 라인을 돌파하면 Long입니다. 기본값은 8시간봉에 최적화 되어 있으며, 다른 시간봉은 직접 최적값을 찾아보십시오. 아래는 LonesomeTheBlue의 Linear Regression Channel에 대한 설명을 퍼왔습니다.
________________________________________________
There are several nice Linear Regression Channel scripts in the Public Library. and I tried to make one with some extra features too. This one can check if the Price breaks the channel and it shows where is was broken. Also it checks the momentum of the channel and shows it's increasing/decreasing/equal in a label, shape of the label also changes. The line colors change according to direction.
using the options, you can;
- Set the Source (Close, HL2 etc)
- Set the Channel length
- Set Deviation
- Change Up/Down Line colors
- Show/hide broken channels
- Change line width
meaning of arrows:
⇑ : Uptrend and moment incresing
⇗ : Uptrend and moment decreasing
⇓ : Downtrend and moment incresing
⇘ : Downtrend and moment decreasing
⇒ : No trend
Note di rilascio
[Important changes]In the previous version of the long and short conditions, the following second case was added to maximize the profit. The default values have also been changed accordingly.
Long condition
1. Slope < 0, break the upper line (original v1)
or
2. Slope > 0, break the top line (added in v2)
Short condition
1. Slope > 0, break the bottom line (original v1)
or
2. Slope < 0, break the bottom line (added in v2)
Note di rilascio
In previous versions, when setting stop loss and take profit, positions would close at an incorrect target price. The fixed version closes positions exactly at the set Stop Loss and Take Profit % values, so you can backtest accurately when applying Stop Loss and Take Profit with this strategy. To use the strategy the same as the previous version, simply uncheck enable SL/TP.__________________________________________________
이전 버전에서 손절, 익절 설정 시 정확하지 않은 목표가에서 포지션이 닫히는 문제가 있었습니다. 수정된 버전은 설정된 손절과 익절 % 값에 맞게 정확하게 포지션을 닫게해줍니다. 따라서 본 전략으로 손절과 익절을 사용하는 경우 정확하게 백테스팅할 수 있습니다. 기존 버전과 동일하게 전략을 사용하려면 enable SL/TP 체크를 해제하시면 됩니다.
Script open-source
Nello spirito di TradingView, l'autore di questo script lo ha reso open source, in modo che i trader possano esaminarne e verificarne la funzionalità. Complimenti all'autore! Sebbene sia possibile utilizzarlo gratuitamente, ricordiamo che la ripubblicazione del codice è soggetta al nostro Regolamento.
Declinazione di responsabilità
Le informazioni e le pubblicazioni non sono intese come, e non costituiscono, consulenza o raccomandazioni finanziarie, di investimento, di trading o di altro tipo fornite o approvate da TradingView. Per ulteriori informazioni, consultare i Termini di utilizzo.