OPEN-SOURCE SCRIPT
Highest Volume Bar from a Lower Timeframe
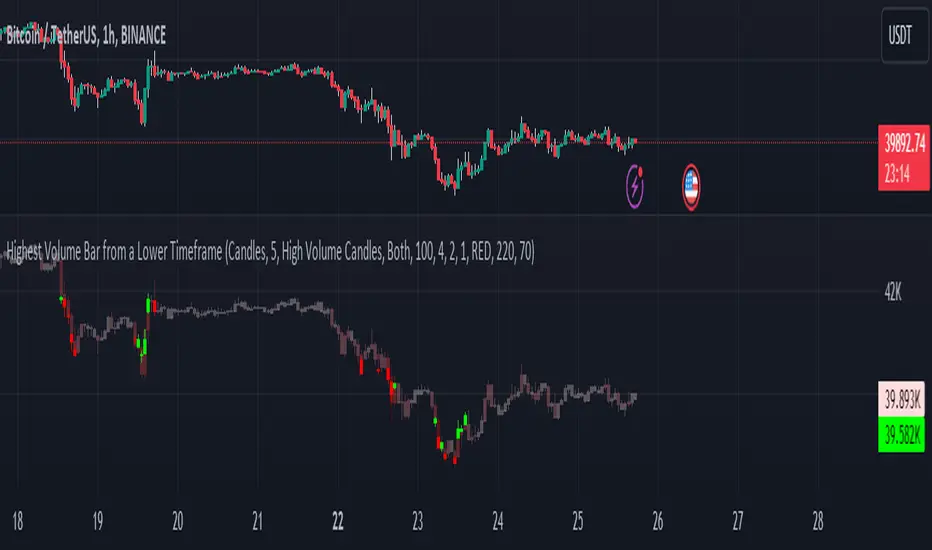
Volume is an essential indicator in technical analysis as it can signal confirmations of movement, reversals, and more. This indicator was developed to identify candles with high volume in both the current timeframe and a lower timeframe
SETTINGS
The indicator has two display modes: Candles and Volume.
- Candles: it presents a traditional candlestick chart that shows the candles of the current timeframe, along with the candle with the highest volume from the lower timeframe.
- Volume: it features a volume chart displaying the volume of the current timeframe in histogram form, as well as the bar with the highest volume from the lower timeframe represented in columns.
LOWER TIME FRAME SETTINGS
- Lower Time Frame: the lower timeframe to be taken into consideration.
- LTF Candle Display: determines which candles from the current timeframe chart will display the candles with the highest volume from the lower timeframe.
- Volume Display: determines how the volume bars will be presented for both the current timeframe and the lower timeframe.
VOLUME LEVEL SETTINGS
- SMA Period: the time period for calculating the volume average.
- High Volume: the multiplier used to classify a candle as having high volume.
- Medium Volume: the multiplier used to classify a candle as having medium volume.
- Low Volume: the multiplier used to classify a candle as having low volume.
- Show Volume MA: enable this option to display the Volume MA on the chart.
COLOR SETTINGS
- Candle Color: the color to be used in the charts.
- Shade Intensity [1-255]: the intensity of the shades for volume levels.
- Transparency [1-100]: the transparency to be used for the candles of the current timeframe when displaying candles with higher volume from the lower timeframe.
Script open-source
Nello spirito di TradingView, l'autore di questo script lo ha reso open source, in modo che i trader possano esaminarne e verificarne la funzionalità. Complimenti all'autore! Sebbene sia possibile utilizzarlo gratuitamente, ricordiamo che la ripubblicazione del codice è soggetta al nostro Regolamento.
Declinazione di responsabilità
Le informazioni e le pubblicazioni non sono intese come, e non costituiscono, consulenza o raccomandazioni finanziarie, di investimento, di trading o di altro tipo fornite o approvate da TradingView. Per ulteriori informazioni, consultare i Termini di utilizzo.