OPEN-SOURCE SCRIPT
Aggiornato Historical Volatility Bands [Loxx]
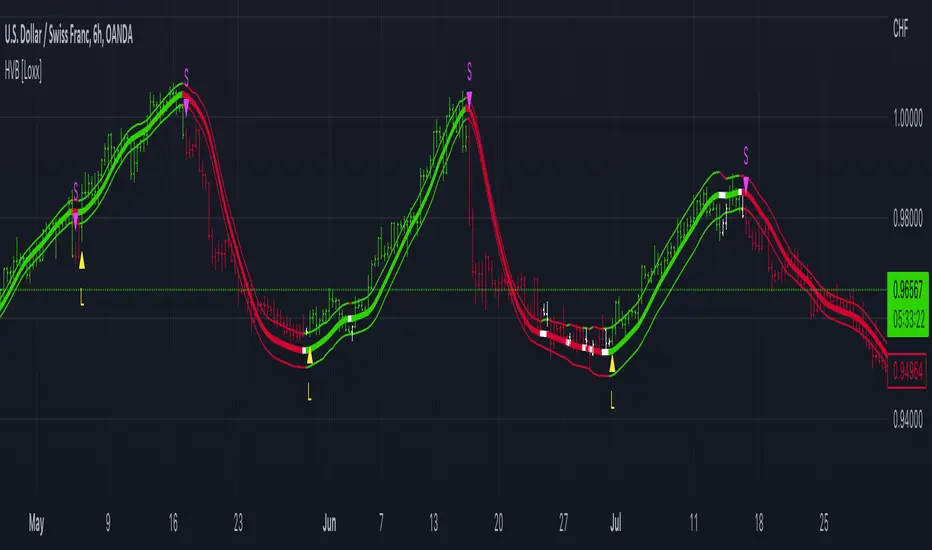
Historical Volatility Bands are constructed using:
What is Historical Volatility?
Historical Volatility (HV) is a statistical measure of the dispersion of returns for a given security or market index over a given period of time. Generally, this measure is calculated by determining the average deviation from the average price of a financial instrument in the given time period. Using standard deviation is the most common, but not the only, way to calculate Historical Volatility.
The higher the Historical Volatility value, the riskier the security. However, that is not necessarily a bad result as risk works both ways - bullish and bearish, i.e: Historical Volatility is not a directional indicator and should not be used as other directional indicators are used. Use to to determine the rising and falling price change volatility.
The color of the middle line, unlike the bands colors, has 3 colors. When colors of the bands are the same, then the middle line has the same color, otherwise it's white.
Included
- Average as the middle line.
- Upper and lower bands using the Historical Volatility for bands calculation.
What is Historical Volatility?
Historical Volatility (HV) is a statistical measure of the dispersion of returns for a given security or market index over a given period of time. Generally, this measure is calculated by determining the average deviation from the average price of a financial instrument in the given time period. Using standard deviation is the most common, but not the only, way to calculate Historical Volatility.
The higher the Historical Volatility value, the riskier the security. However, that is not necessarily a bad result as risk works both ways - bullish and bearish, i.e: Historical Volatility is not a directional indicator and should not be used as other directional indicators are used. Use to to determine the rising and falling price change volatility.
The color of the middle line, unlike the bands colors, has 3 colors. When colors of the bands are the same, then the middle line has the same color, otherwise it's white.
Included
- Alerts
- Signals
- Loxx's Expanded Source Types
- Bar coloring
Note di rilascio
Updated to handle all timeframes and all tickers. Script open-source
Nello spirito di TradingView, l'autore di questo script lo ha reso open source, in modo che i trader possano esaminarne e verificarne la funzionalità. Complimenti all'autore! Sebbene sia possibile utilizzarlo gratuitamente, ricordiamo che la ripubblicazione del codice è soggetta al nostro Regolamento.
Public Telegram Group, t.me/algxtrading_public
VIP Membership Info: patreon.com/algxtrading/membership
VIP Membership Info: patreon.com/algxtrading/membership
Declinazione di responsabilità
Le informazioni e le pubblicazioni non sono intese come, e non costituiscono, consulenza o raccomandazioni finanziarie, di investimento, di trading o di altro tipo fornite o approvate da TradingView. Per ulteriori informazioni, consultare i Termini di utilizzo.
Script open-source
Nello spirito di TradingView, l'autore di questo script lo ha reso open source, in modo che i trader possano esaminarne e verificarne la funzionalità. Complimenti all'autore! Sebbene sia possibile utilizzarlo gratuitamente, ricordiamo che la ripubblicazione del codice è soggetta al nostro Regolamento.
Public Telegram Group, t.me/algxtrading_public
VIP Membership Info: patreon.com/algxtrading/membership
VIP Membership Info: patreon.com/algxtrading/membership
Declinazione di responsabilità
Le informazioni e le pubblicazioni non sono intese come, e non costituiscono, consulenza o raccomandazioni finanziarie, di investimento, di trading o di altro tipo fornite o approvate da TradingView. Per ulteriori informazioni, consultare i Termini di utilizzo.